How the Census 2020 response rate varied across Indiana: A granular view by tract

Due to the pandemic, we see some of the largest self-response declines within our college communities, as many campuses were being closed at the time when census materials were being distributed in March.
The first wave of data from Census 2020—the statewide numbers used to apportion congressional seats—will be released in the near future after multiple delays.1
Those who have followed the news about the decennial census know that Census 2020 has been plagued with a variety of problems that have raised accuracy concerns. The best way to ensure an accurate census is for households to “self-respond”—i.e., fill out the form themselves (online, by phone or by mail)—and not rely on the Census Bureau to follow-up and gather that information itself. In fact, “low self-response rates are correlated with people being missed in the census.”2
Indiana’s final self-response rate was 70.3%, close to 1 percentage point higher (0.7) than in Census 2010. But as mentioned in an earlier article,3 most census tracts actually had lower self-response rates relative to their Census 2010 rates. This article dives a bit deeper into the local self-response numbers (using the final set of self-response data from October 28, 2020).
Census tracts are small, relatively permanent subdivisions of a county used for statistical purposes. They generally follow visible and identifiable land-based features and have between 1,500 and 8,000 people, with an optimum size of 4,000 people.4
Figure 1 shows that 292 of the state’s tracts had 80% or more of households self-respond to the census, while 328 tracts had less than 60% of households respond. The tract with the lowest self-response rate in the state (22.2%) is in Gary (Lake County)—that particular tract reports a very high vacancy rate according to the most recent American Community Survey.5 The tract with the highest self-response rate in the state (91.9%) is within Carmel (Hamilton County).
Figure 1: 2020 Census self-response rates by census tract
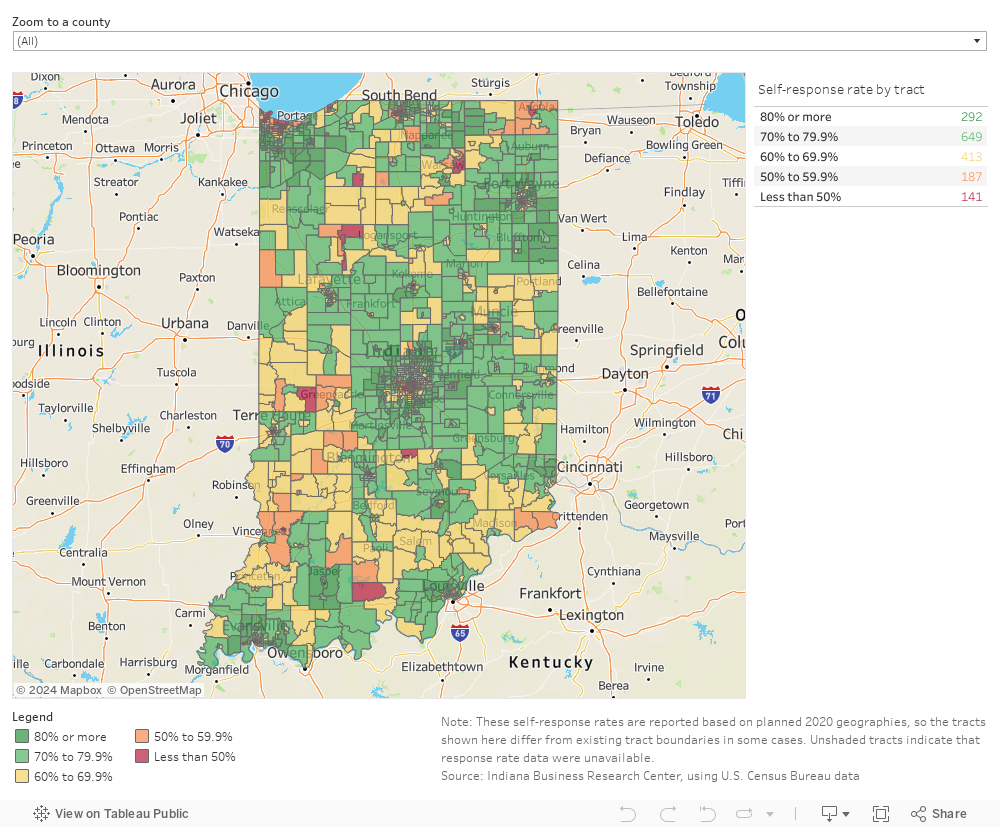
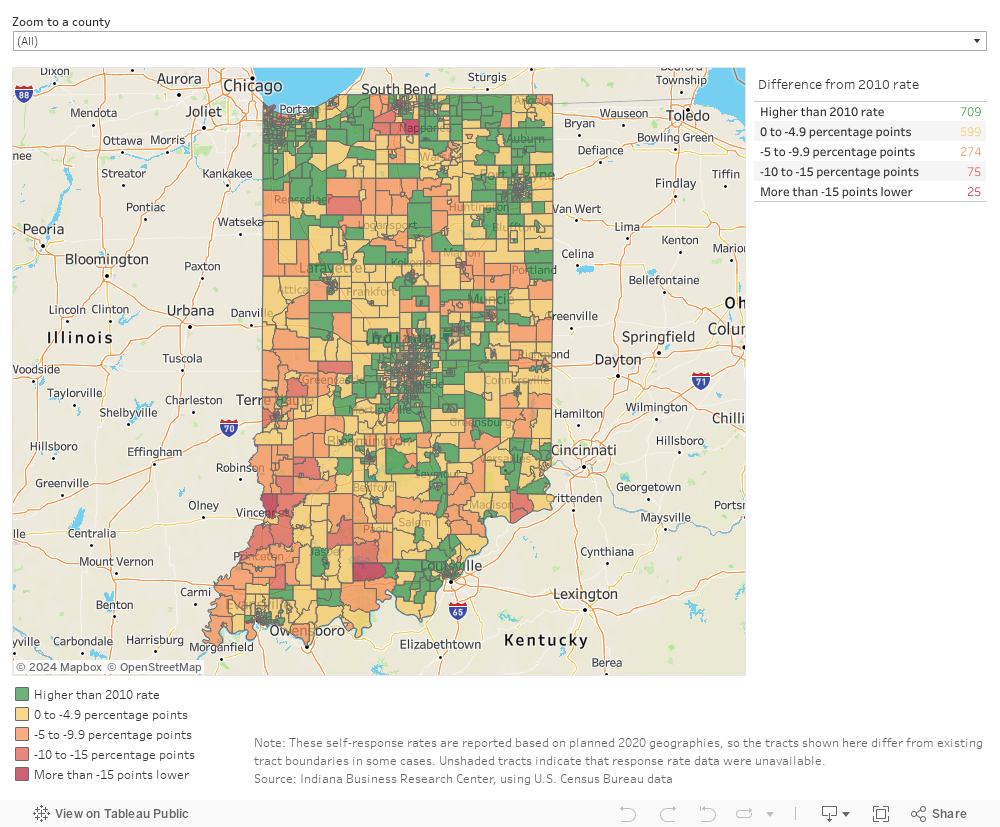
Table 1 provides a quick comparison to the Census 2010 rates. Overall, the high responders stayed high, the low responders stayed low, but there was much fluctuation among the middle groups.
Table 1: Comparison of Census 2010 and 2020 self-response rates by tract
| Census 2010 response rate | Census 2020 response rate | ||||
|---|---|---|---|---|---|
| 80% or more | 70% to 79.9% | 60% to 69.9% | 50% to 59.9% | Less than 50% | |
| 80% or more | 207 | 52 | - | - | - |
| 70% to 79.9% | 85 | 503 | 158 | 12 | 3 |
| 60% to 69.9% | - | 90 | 228 | 86 | 11 |
| 50% to 59.9% | - | 4 | 26 | 85 | 66 |
| Less than 50% | - | - | 1 | 4 | 61 |
Source: Indiana Business Research Center, using U.S. Census Bureau data
In all, 709 tracts (42%) bested their 2010 rates and 599 (36%) were less than 5 percentage points lower (see Figure 2).
Figure 2: Tract-level 2020 Census self-response compared to Census 2010
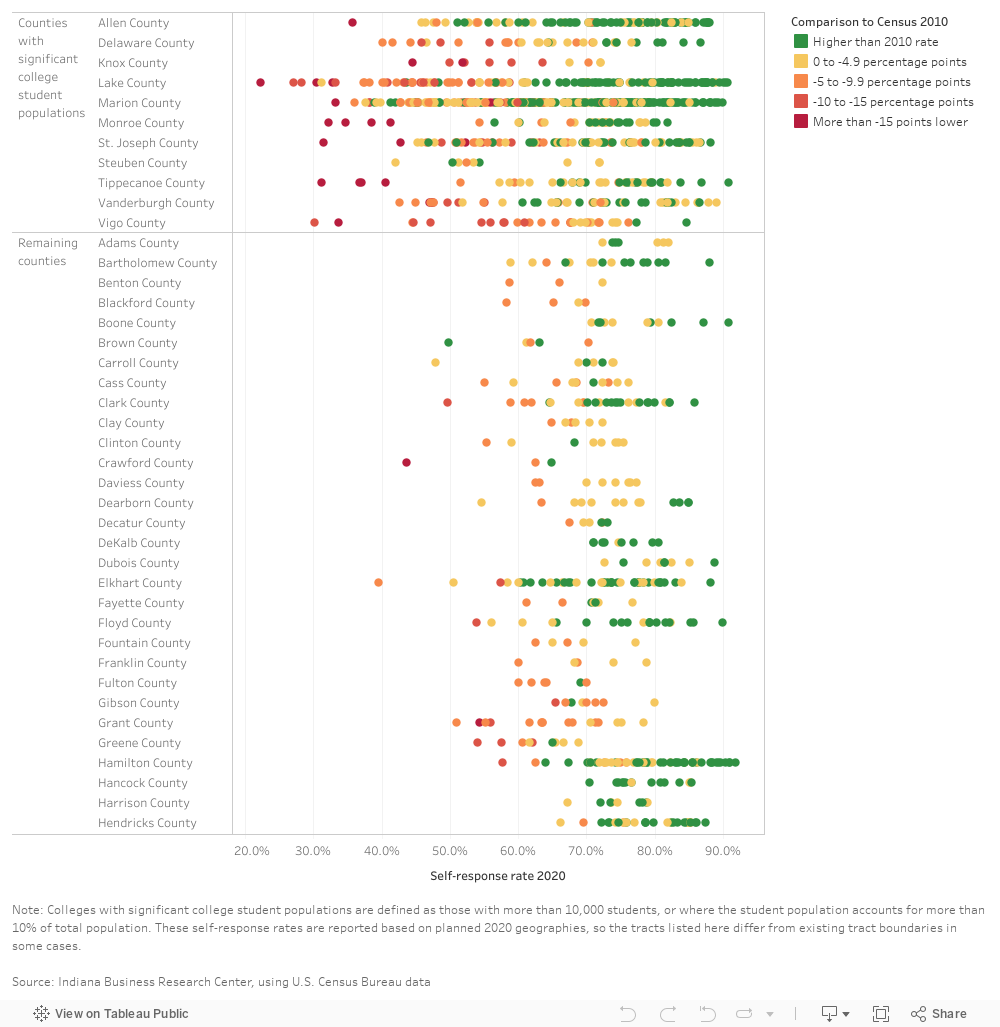
One area of particular concern (nationwide) are college communities. Due to the pandemic, we see some of the largest self-response declines within our college communities, as many campuses were being closed at the time when census materials were being distributed in March. The pandemic also complicated non-response follow-up in these areas during the late spring and early summer months.6 It is important to note that those who live in dorms on campus were counted during the group quarters enumeration, so the low response rate concern revolves around students living off campus.
Indiana has nine counties where student enrollment surpasses 10,000 (see Table 2). In six counties, the student population makes up more than 10% of total population—led by Monroe County (Indiana University) at 29%.
Table 2: Indiana counties with college student populations
| County Name | Enrollment | Total population | Enrollment as a percent of population |
|---|---|---|---|
| Marion | 43,700 | 964,582 | 4.5% |
| Monroe | 43,002 | 148,431 | 29.0% |
| Tippecanoe | 41,953 | 195,732 | 21.4% |
| St. Joseph | 21,055 | 271,826 | 7.7% |
| Delaware | 20,333 | 114,135 | 17.8% |
| Vigo | 15,099 | 107,038 | 14.1% |
| Lake | 13,005 | 485,493 | 2.7% |
| Allen | 11,806 | 379,299 | 3.1% |
| Vanderburgh | 10,856 | 181,451 | 6.0% |
| Knox | 9,006 | 36,594 | 24.6% |
| Grant | 5,383 | 65,769 | 8.2% |
| Floyd | 4,363 | 78,522 | 5.6% |
| Steuben | 4,320 | 34,594 | 12.5% |
| Wayne | 4,107 | 65,884 | 6.2% |
| Porter | 3,786 | 170,389 | 2.2% |
| Howard | 2,762 | 82,544 | 3.3% |
| Putnam | 2,156 | 37,576 | 5.7% |
| Kosciusko | 2,029 | 79,456 | 2.6% |
| Madison | 1,722 | 129,569 | 1.3% |
| Wabash | 1,525 | 30,996 | 4.9% |
| Gibson | 1,419 | 33,659 | 4.2% |
| Huntington | 1,302 | 36,520 | 3.6% |
| Jefferson | 1,104 | 32,308 | 3.4% |
| Johnson | 982 | 158,167 | 0.6% |
| Jasper | 972 | 33,562 | 2.9% |
| Elkhart | 927 | 206,341 | 0.4% |
| Montgomery | 882 | 38,338 | 2.3% |
| Marshall | 415 | 46,258 | 0.9% |
| Clark | 122 | 118,302 | 0.1% |
Bold indicates counties with significant college student populations either in numeric (more than 10,000 students) or percentage (more than 10% of total population) terms.
Note: The underlying enrollment data for public schools is full-time enrollment, while private school data includes both full- and part-time enrollment. Community colleges, such as Ivy Tech, are not included for our purposes here since they largely serve the resident population.
Source: Indiana Business Research Center, using data from the Indiana Commission for Higher Education (public school data for FY 2018), CollegeSimply (private school data for academic years 2019/2020 and 2018/2019) and the U.S. Census Bureau (2019 population estimates).
Figure 3 shows the tract-level response rate for the counties with significant college student populations (either in numeric or percentage terms), alongside the remainder of the state.
Not all of the poor response in these counties can be traced to the student population. For example, the tracts with the lowest response in Allen, Knox and Lake counties are not campus related. However, out of the 26 tracts in the state with the largest declines in response rate (i.e., more than 15 percentage points), 16 would appear to be impacted by poor off-campus student response.
In particular, both Monroe County and Tippecanoe County (Purdue University) have four tracts where response rates were less than 45%—representing declines between 15 and 30 percentage points.
Figure 3: Tract self-response rates by county
As more 2020 census data gets released throughout the coming year, researchers here at the Indiana Business Research Center will give extra scrutiny to those areas with low self-response rates to see if any anomalies arise in the final data for Indiana. Results of our review will be made available on the Census in Indiana website (www.census.indiana.edu/), as well as in InContext.
Notes
- Hansi Lo Wang, “Census numbers for dividing up House seats delayed until April 30, bureau says,” January 27, 2021, www.npr.org/2021/01/27/961247853/census-numbers-for-dividing-up-house-seats-delayed-until-april-30-bureau-says
- Center for Urban Research, “Census self-response rates mapped and analyzed: 2000, 2010, and (soon) 2020,” March 16, 2020, www.gc.cuny.edu/Page-Elements/Academics-Research-Centers-Initiatives/Centers-and-Institutes/Center-for-Urban-Research/CUR-research-initiatives/Census-Self-Response-Rates-Mapped-and-Analyzed-2000,-2010,-and-(soon)-2020
- Rachel Strange, “Hoosiers responded comparatively well to the 2020 Census,” InContext, Nov-Dec 2020, www.incontext.indiana.edu/2020/nov-dec/article2.asp
- “Glossary,” U.S. Census Bureau, www.census.gov/programs-surveys/geography/about/glossary.html#par_textimage_13
- Lake County’s Tract 121 had a vacancy rate of 59.5% according to the 2019 five-year American Community Survey estimate.
- The Inspector General issued a warning regarding the enumeration of off-campus students due to the cancellation of early non-response follow-up and the closure of many colleges. The bureau had requested administrative data from college and university administrators to assist in counting off-campus students, but still did not have finalized plans in place for using those data as of August 27, 2020. See memorandum titled, “2020 Census alert: The Census Bureau may not accurately count college and university students living off-campus during the 2020 Census,” https://www.oig.doc.gov/OIGPublications/OIG-20-044-M.pdf.