Hoosiers responded comparatively well to the 2020 Census
70% of Hoosier households responded to the census and did not require a visit from a census employee.
Conducting a national census is no easy task—made immensely harder this year by the pandemic, changing deadlines and eleventh-hour court battles over those shifting deadlines.1
When a household completes the form online, by phone or by mail, it is known as “self-response.” When households don't respond to the questionnaires, the Census Bureau must send fieldworkers to their addresses in an effort to collect their responses. This is called non-response follow-up (NRFU).
Indiana as a whole had a self-response rate of 70.0% (as of 9/30/20). When one adds in the data collected via NRFU, Indiana’s total enumeration rate goes up to 99.8%—one of the highest in the nation at the time of this writing.2
Since high self-response rates are correlated with more accurate data and lower costs, this article will focus on how many Hoosiers self-responded to the 2020 Census for various geographies. All data is reported as of September 30, 2020. (That date was supposed to mark the end of data collection according to the bureau’s third schedule, which was contested in court.)
State comparison
Indiana (70%) ranked 13th among states, surpassing the national self-response rate of 66.5%. Self-response ranged from 54% in Alaska to 75% in Minnesota (see Figure 1).
Figure 1: 2020 Census self-response rates by state
Source: IBRC, using U.S. Census Bureau data
Despite a year that was turned upside down by COVID-19, Indiana was among the states that ended up bettering their Census 2010 self-response rates in 2020, though just by 0.4 percentage points (see Figure 2).
Figure 2: Comparison of self-response for the past two censuses by state
Source: IBRC, using U.S. Census Bureau data
Indiana counties
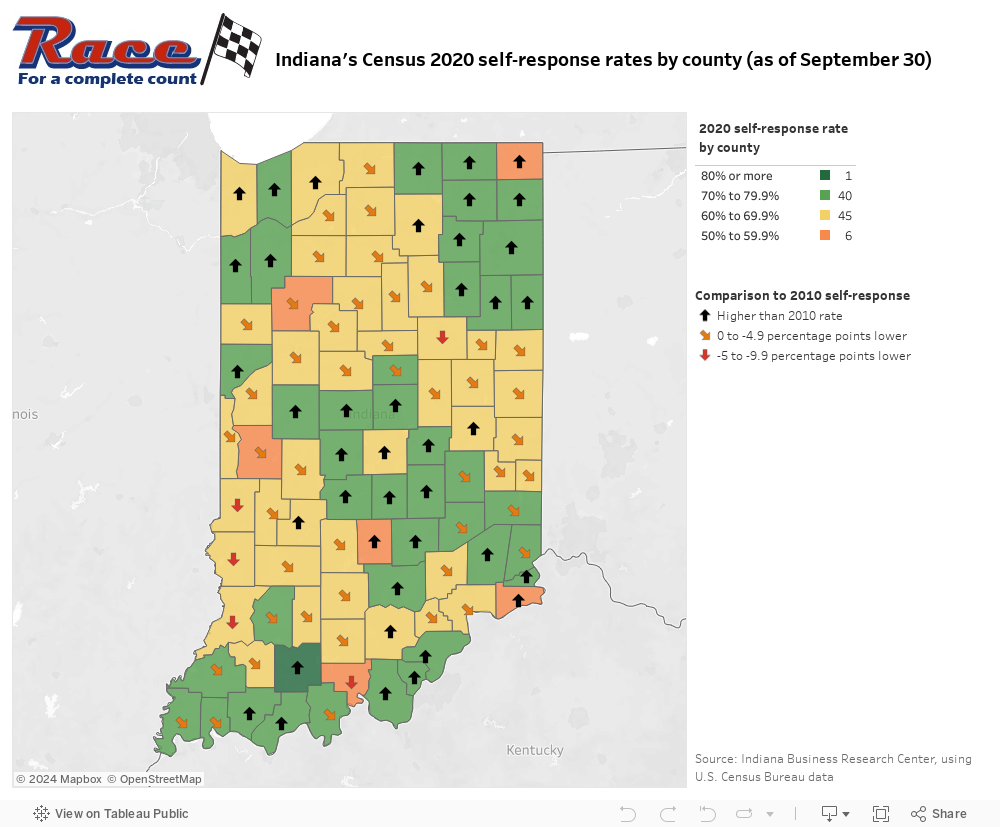
Within Indiana, self-response ranged from 54.1% in Crawford County to 80.7% in Dubois County (see Figure 3). Roughly half of the state’s 92 counties had lower self-response than in the prior census, with a handful of counties (Crawford, Knox, Sullivan and Vigo) more than 5 percentage points below their Census 2010 self-response rates.
Figure 3: 2020 Census self-response rates by county
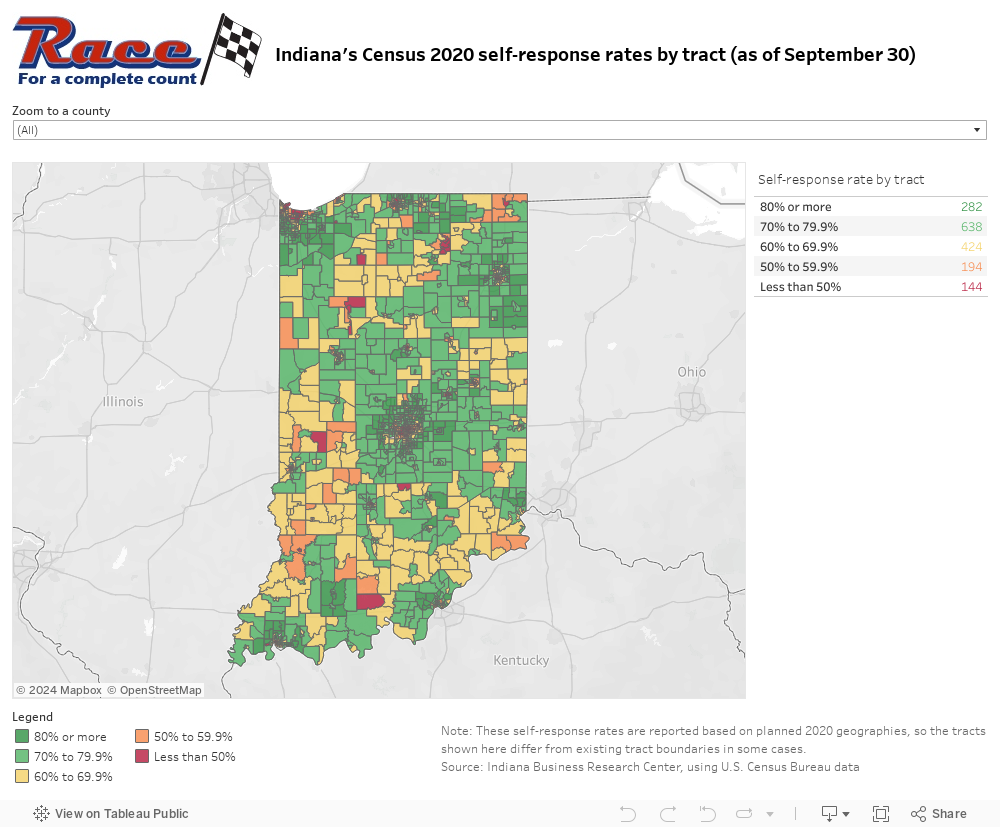
Indiana census tracts
Not only do self-response rates vary dramatically from county to county, but they also vary within counties. Figure 4 shows these rates by tract.3 Most tracts (59%) actually had lower response rates relative to their Census 2010 rates, which is a topic we plan to discuss more in a future article.
Figure 4: 2020 Census self-response rates by census tract
Conclusion
Just about everything about this census has been difficult, and there are several worrisome questions still unanswered. For example, how much has the shortened NRFU timeframe undermined quality control, increased undercounts and lowered accuracy due to more use of proxy data? In fact, the American Statistical Association has stated:
“The percent of completed cases does not suffice to draw conclusions about data quality. For example, included in the tally of completed enumerations are households counted through a proxy response from a neighbor, including cases in which the proxy could provide no information beyond a guess of the number of individuals living in the household. In fact, meeting enumeration goals for a truncated deadline increases the likelihood of operational shortcuts that will jeopardize the quality of the count.”4
Will pushing ahead to try to meet the December 31 delivery of apportionment data shortchange the quality review process and introduce “fatal” data problems?5 What in the world are they going to do about accurately enumerating college towns?6 And to top things off, the bureau is rolling out a brand new differential privacy process that it is still in the process of fine-tuning.7
Nevertheless, as a state, we should at least find a tiny bit of satisfaction that—even in the middle of a pandemic—70% of our households responded to the census and did not require a visit from a census employee. The same cannot be said for many other states.
Notes
- We have neither the space nor the desire to chronicle all of that here, but the interested reader should explore the work of Hansi Lo Wang at NPR for more details: www.npr.org/people/177498291/hansi-lo-wang.
- It is worth recognizing that operational shortcuts were used to meet a shortened enumeration timeline, so total enumeration rates are high at the expense of accuracy. This may be slightly less of a concern in Indiana, since much of the state was part of the NRFU soft launch that got enumerators on the ground earlier than in other parts of the country. For a current state-level map of completion rates, see www.censushardtocountmaps2020.us/img/mappdfs/TotalRates/NRFU_TotalResponseRates_latest.pdf.
- Census tracts generally follow visible and identifiable features and have between 1,500 and 8,000 people, with an optimum size of 4,000 people.
- American Statistical Association, “2020 Census quality indicators: A report from the American Statistical Association,” October 2020, www.amstat.org/asa/files/pdfs/POL-2020CensusQualityIndicators.pdf, 1.
- Hansi Lo Wang, “Census could look ‘manipulated’ if cut short by Trump officials, Bureau warned,” NPR, September 20, 2020, www.npr.org/2020/09/20/914692254/census-could-look-manipulated-if-cut-short-by-trump-officials-bureau-warned.
- The Inspector General issued a warning regarding the enumeration of off-campus students due to the cancellation of early NRFU and the closure of many colleges. The bureau had requested administrative data from college and university administrators to assist in counting off-campus students, but still did not have finalized plans in place for using those data as of August 27, 2020. See memorandum titled, “2020 Census alert: The Census Bureau may not accurately count college and university students living off-campus during the 2020 Census,” https://t.co/4DCIWlqBUH?amp=1.
- Matt Kinghorn, “Census 2020: Balancing privacy and data reliability,” InContext, May-June 2020, www.incontext.indiana.edu/2020/may-jun/article3.asp.