The comeback: How Hoosiers are recovering from the economic shutdown

Nonstore retailers are experiencing the most growth in job postings, unsurprising due to more people shopping online.
This age of COVID-19 and the resulting recession has impacted every Hoosier. It is no surprise that the economy has taken a hit. While there are many ways to assess Indiana’s shutdown and/or recovery-in-progress, exploring a few traditional labor market information (LMI) sources, as of August 2020 (preliminary data), should provide some insight.
Since the closures related to COVID-19 basically happened all at once, the economic recession that began in the spring makes it unlike previous recessions in many respects. Indiana’s seasonally adjusted unemployment rate went from a low of 3.0% in March 2020 to a high of 17.5% the following month of April. This peak was higher than the Great Recession peak of 11.0% in January and February of 2010.
The unemployment insurance (UI) claims followed a similar trend of magnitude. The initial UI claims peaked at 120,331 claims for the week ending March 28, 2020. This was more than four times greater than the number of initial UI claims during the highest peak in the recession (week ending Dec. 27, 2008), and it was over 52 times greater than the number of initial UI claims in the week before the spike of claims (week ending March 14, 2020).
According to the seasonally adjusted figures of the Current Employment Statistics program, Indiana’s total nonfarm employment declined 14% from February to April.
When looking at second quarter real gross domestic product (GDP), Indiana’s economy declined 33% from the previous quarter, according to data from the U.S. Bureau of Economic Analysis.
The comeback
The big picture
Indiana is nearing the employment levels experienced pre-recession, according to the Current Employment Statistics from the Indiana Department of Workforce Development. For the purposes of this article, the pre-recession level is defined as the average of January 2020 and February 2020. In August, total nonfarm employment, which includes both private and public jobs, is at 3,056,100 seasonally adjusted jobs, which was 4% fewer jobs than the pre-recession period.
Online job postings are experiencing a similar trend, according to the seasonally adjusted data from Burning Glass Technologies. In August, Indiana had 65,017 seasonally adjusted job postings. This was also 4% down from pre-recession postings.
Although Indiana still hasn’t quite caught up to its pre-recession levels, the state is trending in the right direction (see Figure 1).
Figure 1: Percent change in employment and job postings relative to pre-recession levels
Note: Data are seasonally adjusted.
Source: Current Employment Statistics, Indiana Department of Workforce Development (employment) and Burning Glass Technologies (job postings)
By industry
In 2019, Indiana’s six largest supersectors (a term from the U.S. Bureau of Labor Statistics) were
- Trade, transportation and utilities
- Manufacturing
- Private education and health services
- Government (includes public schools and hospitals)
- Professional and business services
- Leisure and hospitality
Out of these top six supersectors, leisure and hospitality experienced the largest job losses in April, both in terms of number (-127,150) and percentage (-41%)—approaching half of all jobs in the sector.
As seen in Figure 2, Indiana’s six largest supersectors have a little ways to go to catch up with pre-recession levels.
Figure 2: Employment change for the top six industry supersectors relative to pre-recession levels
Note: Data are seasonally adjusted.
Source: Current Employment Statistics, Indiana Department of Workforce Development
Online job postings provide an excellent way to see which industries are experiencing unique growth during this time, especially when looking at the percent change of job postings from pre-recession levels. Table 1 shows industries that are posting ads at a higher rate than normal. For example, nonstore retailers (ranked #1) are experiencing the most growth (by far), unsurprising due to more people shopping online. Thus, online groceries and their distribution centers need to hire more workers to meet this demand. It is likely many workers from the leisure and hospitality sector are now gaining employment in this sector.
Table 1: Online job postings by industry
| Industry (NAICS 3-digit) | Jan/Feb average | Aug | Change | Percent change |
|---|---|---|---|---|
| Nonstore retailers | 91 | 2,207 | 2,117 | 2,339% |
| Miscellaneous store retailers | 296 | 687 | 392 | 132% |
| Data processing, hosting and related services | 39 | 73 | 35 | 90% |
| Couriers and messengers | 265 | 492 | 227 | 86% |
| Heavy and civil engineering construction | 35 | 58 | 23 | 66% |
| Wood product manufacturing | 45 | 71 | 26 | 58% |
| General merchandise stores | 1,133 | 1,638 | 506 | 45% |
| Plastics and rubber products manufacturing | 32 | 43 | 12 | 37% |
| Postal service | 72 | 97 | 26 | 36% |
| Justice, public order and safety activities | 63 | 81 | 18 | 29% |
Note: Data are seasonally adjusted.
Source: Burning Glass Technologies
By occupation
In addition to looking at the job postings of industries, job postings can also provide insight into the occupations that are experiencing unique growth during this time (see Table 2). Again, packers and packagers (ranked #1) shows the demand that warehouses and distribution centers have during this new growth of online shopping.
Table 2: Online job postings by occupation
| Occupation (SOC 6-digit) | Jan/Feb average | Aug | Change | Percent change |
|---|---|---|---|---|
| Packers and packagers, hand | 95 | 508 | 414 | 438% |
| Loan interviewers and clerks | 31 | 97 | 67 | 218% |
| Stock clerks and order fillers | 591 | 1,633 | 1,042 | 176% |
| Laborers and freight, stock and material movers, hand | 1,123 | 2,796 | 1,674 | 149% |
| Team assemblers | 107 | 226 | 120 | 112% |
| Packaging and filling machine operators and tenders | 41 | 86 | 45 | 110% |
| Home health aides | 232 | 455 | 223 | 96% |
| Carpenters | 78 | 151 | 74 | 95% |
| Amusement and recreation attendants | 32 | 62 | 30 | 94% |
| Production workers, all other | 471 | 908 | 438 | 93% |
Note: Data are seasonally adjusted.
Source: Burning Glass Technologies
One thing to consider during this recovery is that most of those jobs that are experiencing unique growth are low-skill and low-wage jobs. The distribution of education credentials in Table 3 attests to the argument that the unique growth in job postings for August are for lower skill jobs.
Table 3: Online job postings by education credential
| Minimum education advertised | Jan/Feb average | Aug | Change | Percent change |
|---|---|---|---|---|
| High school or vocational training | 16,988 | 20,341 | 3,353 | 20% |
| Associate degree | 3,694 | 3,493 | -201 | -5% |
| Bachelor’s degree | 11,481 | 8,714 | -2,767 | -24% |
| Master’s degree | 1,226 | 983 | -243 | -20% |
| Doctoral degree | 584 | 410 | -174 | -30% |
Note: Data are seasonally adjusted.
Source: Burning Glass Technologies
By metro area
The hit to Indiana’s economy has been felt across the state, however, certain areas have been hit harder than others. As seen in Figure 3, no metropolitan statistical area (MSA) has fully recovered in terms of employment; however, the Evansville MSA is only 1.9% lower than its pre-recession level. The Elkhart-Goshen MSA declined the most (down 20.7% from pre-recession to April 2020), but has experienced the second-greatest comeback (up 14.1% from April 2020 to August 2020). The Kokomo MSA had the second-largest decline (down 19.3% from pre-recession to April 2020), but has experienced the greatest comeback (up 19.1% from April 2020 to August 2020).
Figure 3: Employment change by metro area
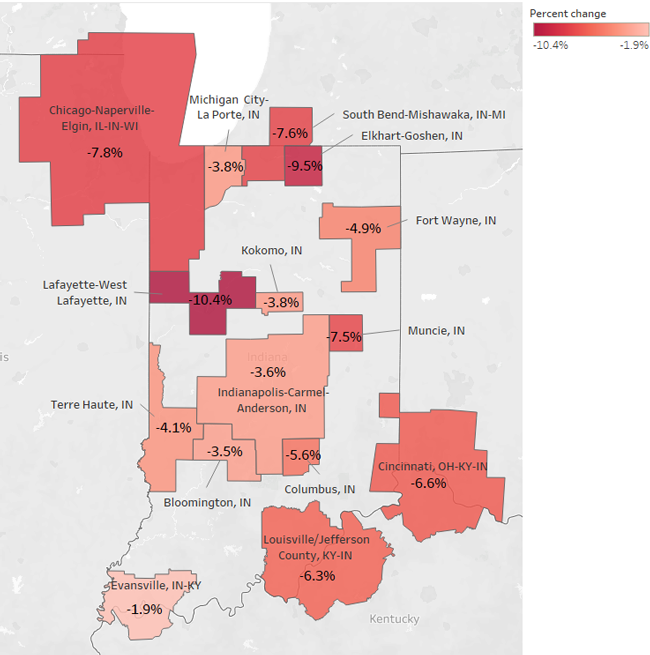
Note: Data are seasonally adjusted.
Source: Current Employment Statistics, Indiana Department of Workforce Development
Find more
Much of the traditional labor market information found in this article can be found at the Hoosiers by the Numbers website (https://www.hoosierdata.in.gov). This website provides info on state and local employment, unemployment rates, UI claims and other economic indicators.
There are two pages within Hoosiers by the Numbers worth highlighting:
-
COVID-19 Resource Hub: This page, curated to capture the most useful information, is dedicated to the many COVID-19 data and tools that exist to understand the full scope of the pandemic—from the disease itself to the impacts on the economy.
-
Economic Region Analysts: For those wanting to look at your own local labor market, this is a good place to start. Each regional analyst page provides up-to-date indicators on the region and custom labor market reports. You can subscribe to these reports, view some helpful regional stats and other regional tools/resources, or get the contact information for your regional workforce analyst.