Peaks to Lows: Mapping the Recession
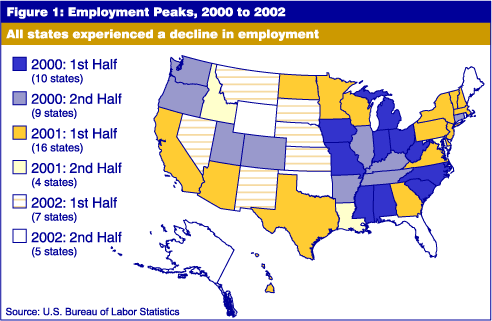
When did the recession start? It all depends on where you were. As measured by seasonally adjusted data from the U.S. Bureau of Labor Statistics, the recession first began in Iowa with a decline in employment in April of 2000. Next, five states, including Indiana, saw employment drop in June 2000.
Eventually, all 50 states and the District of Columbia experienced a decline in employment. For Alaska and Oklahoma, that decline appeared only in the preliminary data for December 2002. Hence, when revised, those data may show no decline at all for those states. Figure 1 shows in which half-year period each state peaked.
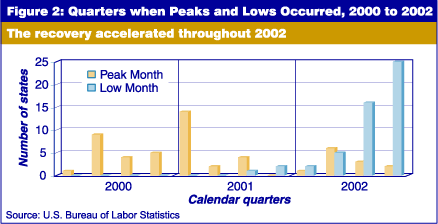
The progress of the recession is shown in Figure 2. Here, the peak is the month before the decline in employment began and the low is the month in which the subsequent minimum level was recorded. In Figure 1, it is evident that the recession (the decline in employment from the recorded peaks) progresses in an irregular fashion while the beginning of recovery from the lows is a smooth and accelerating process. Whether or not this is meaningful is unknown.
The deepest decline in employment was 182,800 jobs in Michigan, attained in December 2002. Indiana's greatest spread between the peak and the low employment of the recession was 122,300 jobs (seventh worst in the nation) reached in June 2002.
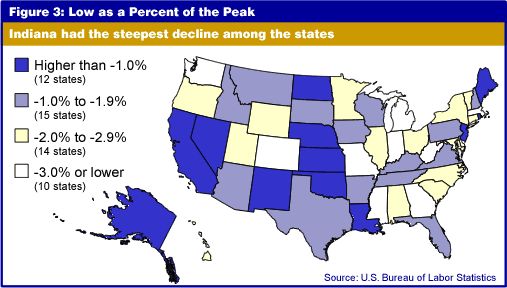
Indiana has the undesirable distinction of having the steepest decline, losing 4.1 percent of its jobs between the May 2000 peak and that June 2002 low. Michigan was second. Oklahoma had the least percentage decline in employment at 0.04 percent with a loss of just 600 jobs from peak to low (see Figure 3).
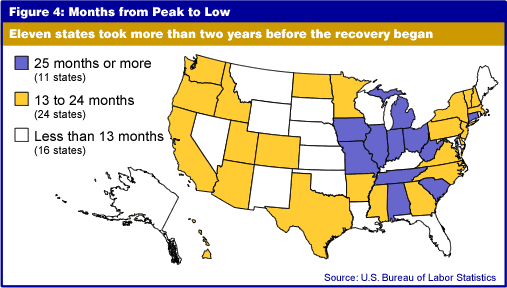
How long did states take to fall from their peaks to their lows? The average was 17 months, with Ohio having the longest slide (31 months) followed by Michigan and Missouri at 30 months. Indiana took 25 months before recovery set in. Figure 4 shows that 11 states took more than two years before the slide in employment stopped.
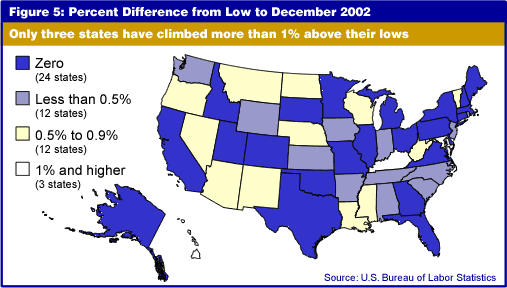
How is the rebound progressing? That too depends on where you are located. In 23 states and the District of Columbia, December 2002 was the recorded low. Again, revisions of these data may change the results. At this point, however, it appears just over half the states have stopped losing jobs. Figure 5 indicates that only three states have climbed more than 1 percent above their lows; Maryland leads these states at 2.3 percent or 54,600 jobs recovered. Indiana ranks 19th in recovery with a 0.3 percent increase (a gain of 9,200 jobs above the June 2002 low).
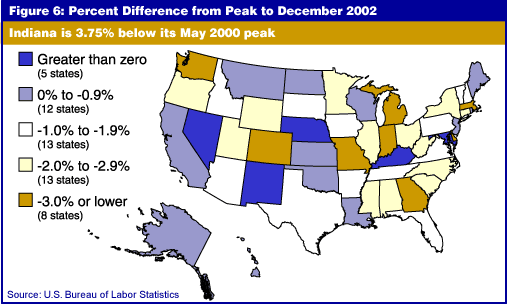
Thus, with recovery underway, how far must we go to return to the previous peaks, ending the recovery and beginning another expansionary period in the U.S. economy? Michigan has the greatest distance to travel as it sits 182,800 (3.9 percent) jobs below its prior peak. Missouri follows at 3.78 percent behind its previous peak. Indiana is a close 48th at 3.75 percent below its May 2000 peak (see Figure 6).
The average state is 1.6 percent below its prior peak. But five have already surpassed that standard and are moving toward new highs. These states are led by Kentucky which is 0.4 percent (6,800 jobs) over its previous high-employment mark. Other states realizing new highs are Nevada, New Mexico, Nebraska and Maryland.
Summary
As measured by employment change, Indiana saw the steepest decline (-4.1 percent) in the recent U.S. recession. That decline began in June 2000 and ended in June 2002, a period of 25 months. Thus far, Indiana has recovered 9,200 of the 122,300 jobs it lost in the recession. This 0.3 percent recovery ranks 19th best in the nation. But with 113,100 jobs still to be recovered (3.75 percent of the prior peak employment level), Indiana has the seventh longest path to follow and the third steepest climb to make before reaching its former employment peak.
Morton J. Marcus
Executive Director, Indiana Business Research Center,
Kelley School of Business, Indiana University