Average wage growth across Indiana industries

Nearly all Indiana industries have seen the annual rate of growth for average wages increase in the short term.
Four industries in Indiana saw increases greater than 10% in the average wage per job between 2019 and 2021 (after adjusting for inflation): administrative, support and waste management (+13.1%); retail trade (11.5%), real estate, rental and leasing (11.0%); and accommodation and food services (10.7%).
As a continuation of the last issue’s discussion of average wages (which focused on wage growth by county),1 this article will explore how Indiana's average wage growth has varied by industry sector, both in the short term and over the past decade.
The underlying wage data come from the Quarterly Census of Employment and Wages (QCEW) data set produced by the U.S. Bureau of Labor Statistics. The Indiana Business Research Center calculates the annual averages from these data and publishes them on STATS Indiana. Please note that all data used in this article are adjusted for inflation.
Before we proceed, it is important to remember that several things impact the average wage calculation aside from a simple increase or decrease in hourly wage. For example, one industry may start employing more part-time workers (this increases the number of jobs in the denominator, but not so much the wages in the numerator). Also, a growing industry (in terms of employment) is likely to hire more entry-level workers (at lower wages). Conversely, an industry with many layoffs is likely to retain its most tenured employees (at higher wages). For example, even though the accommodation and food services industry had a nearly 11% growth in average wages per job since 2019, that industry has also experienced one of the state’s largest employment declines (-8.8%) during that same time. (Furthermore, it is the state’s lowest-paid industry, so changes in percentage terms are larger when the base is smaller.)
Average wage per job by industry
The average annual wage across Indiana in 2021 ranged from $20,150 in accommodation and food services to $114,401 in management of companies and enterprises. The total for all Indiana industries averaged $54,968 (see Figure 1).
Figure 1: Average annual wage per job, 2021
Source: IBRC, using U.S. Bureau of Labor Statistics QCEW annual averages
Short-term wage growth
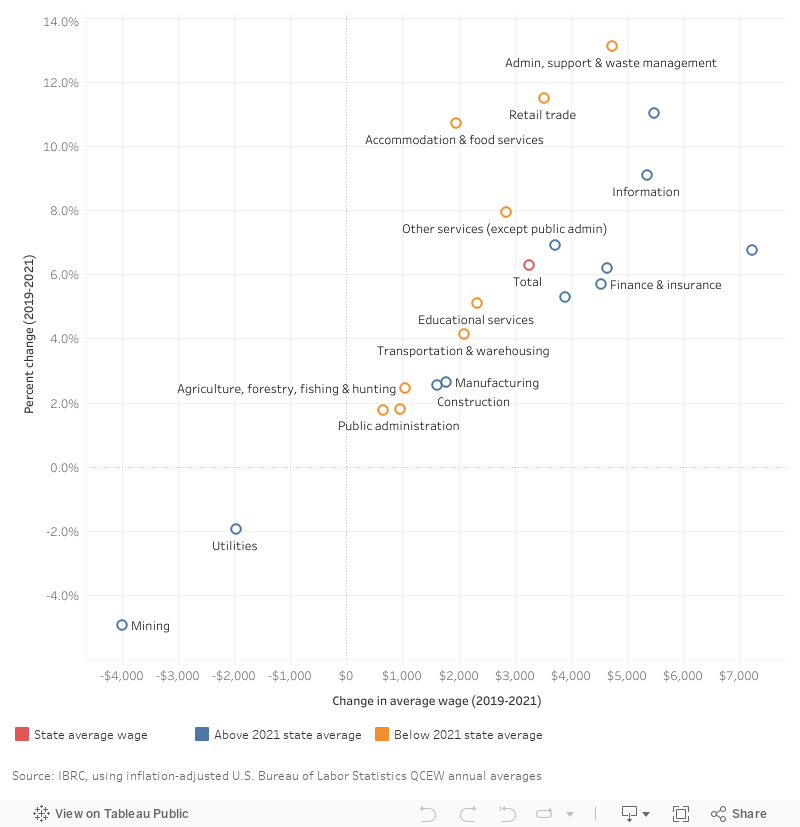
As a whole, Indiana experienced a 6.3% increase in average wage per job between 2019 and 2021. The administrative, support, waste management and remediation industry led the state on this measure with 13.1% growth. In all, four industries saw growth above 10% (see Figure 2). At the other end of the spectrum, utilities and mining saw inflation-adjusted wages decrease in the short term.
Interactive Figure 2: Short-term change in average annual wage per job (adjusted for inflation), 2019 to 2021
Wage growth since 2011
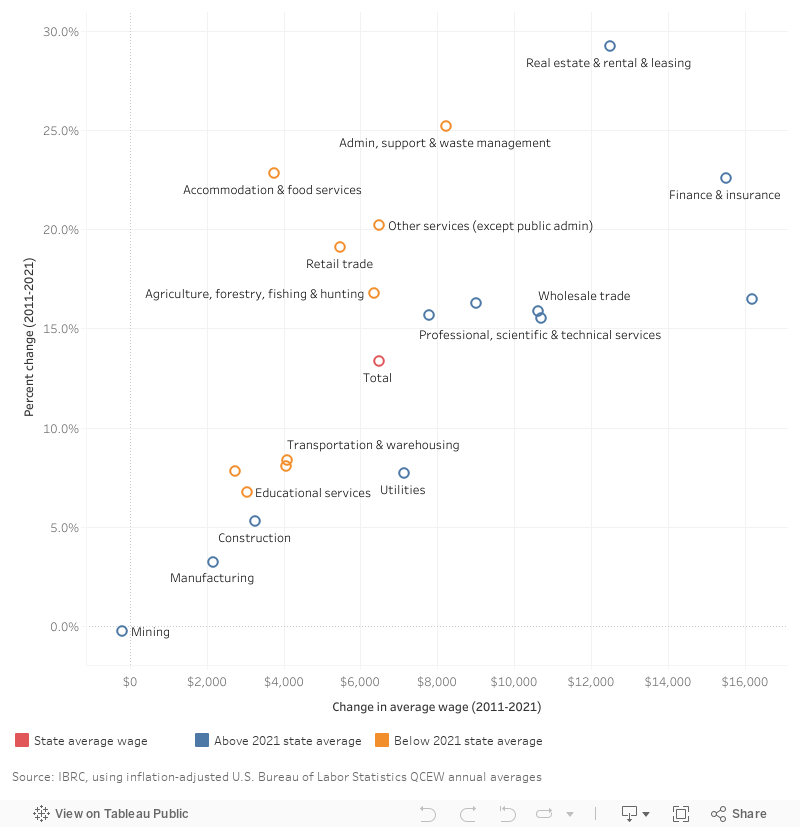
Figure 3 shows details regarding the long-term, 10-year change in average annual wage for all Indiana industries. The real estate and administrative, support, waste management and remediation services industries both gained more than 25%. Meanwhile, manufacturing (+3.2%) and construction (+5.3%) have seen the smallest average gains. Mining (-0.3%) is the only industry where average wages have not kept up with inflation during this longer time frame.
Interactive Figure 3: Long-term change in average annual wage per job (adjusted for inflation), 2011 to 2021
In addition to the total growth over the period, it is also useful to look at the average annual growth rates.2 Nearly all industries have seen the annual rate of growth for average wages increase in the short term (see Table 1).
Table 1: Average annual growth rates for average wage per job
| Industry sector | 2019-2021 annual average |
2011-2021 annual average |
Percentage point difference |
|---|---|---|---|
| Admin, support & waste management | 6.4% | 2.3% | 4.1 |
| Retail trade | 5.6% | 1.8% | 3.8 |
| Accommodation & food services | 5.2% | 2.1% | 3.1 |
| Information | 4.4% | 1.5% | 2.9 |
| Real estate & rental & leasing | 5.4% | 2.6% | 2.8 |
| Other services (except public admin) | 3.9% | 1.9% | 2.0 |
| Health care & social services | 3.4% | 1.5% | 1.9 |
| Educational services | 2.5% | 0.7% | 1.9 |
| Total | 3.1% | 1.3% | 1.8 |
| Management of companies & enterprises | 3.3% | 1.5% | 1.8 |
| Professional, scientific & technical services | 3.1% | 1.5% | 1.6 |
| Transportation & warehousing | 2.0% | 0.8% | 1.2 |
| Wholesale trade | 2.6% | 1.5% | 1.1 |
| Manufacturing | 1.3% | 0.3% | 1.0 |
| Finance & insurance | 2.8% | 2.1% | 0.8 |
| Construction | 1.3% | 0.5% | 0.8 |
| Arts, entertainment & recreation | 0.9% | 0.8% | 0.1 |
| Public administration | 0.9% | 0.8% | 0.1 |
| Agriculture, forestry, fishing & hunting | 1.2% | 1.6% | -0.3 |
| Utilities | -1.0% | 0.7% | -1.7 |
| Mining | -2.5% | 0.0% | -2.5 |
Source: IBRC, using inflation-adjusted U.S. Bureau of Labor Statistics QCEW annual averages
A closer look at individual industries
Table 2 highlights data for Indiana’s four largest industry sectors (in terms of employment). All four have seen employment declines in the short term, but job gains over the decade. In terms of wages, manufacturing continues to have the highest average wage in this group ($68,886), though its average annual growth rate was just 0.3% over the decade (and 1.3% in the short term).
Both retail trade and accommodation and food services have seen a substantial increase in their annual growth rates in wages since 2019 relative to their long-term growth rates.
Table 2: Average wage change in Indiana’s largest industries
| Indicator | Manufacturing | Health care and social services |
Retail trade | Accommodation and food services |
|
|---|---|---|---|---|---|
| 2021 employment | 524,614 | 438,440 | 314,003 | 247,950 | |
| 2021 average wage per job | $68,886 | $57,489 | $34,182 | $20,150 | |
| Change in average wage | 2011-2021 | $2,158 | $7,782 | $5,480 | $3,748 |
| 2019-2021 | $1,773 | $3,717 | $3,522 | $1,951 | |
| Percent change in average wage |
2011-2021 | 3.2% | 15.7% | 19.1% | 22.9% |
| 2019-2021 | 2.6% | 6.9% | 11.5% | 10.7% | |
| Annual average growth rate for average wage per job |
2011-2021 | 0.3% | 1.5% | 1.8% | 2.1% |
| 2019-2021 | 1.3% | 3.4% | 5.6% | 5.2% | |
Source: IBRC, using inflation-adjusted U.S. Bureau of Labor Statistics QCEW annual averages
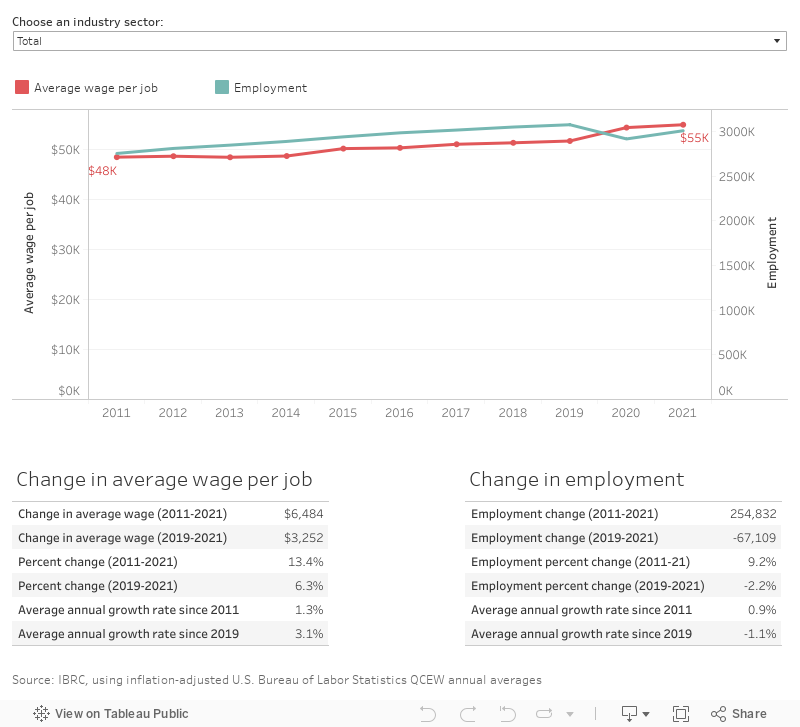
Figure 4 is an interactive graphic where you can explore both employment and wage changes for all of Indiana’s individual industry sectors.
Interactive Figure 4: Change by industry, 2011 to 2021
To explore even more industry-level data by county and/or more of the sub-sector details (just watch out for disclosure issues), visit STATS Indiana’s Employment and Earnings page.
Notes
- Rachel Strange, “Average wage growth across Indiana counties,” InContext, September-October 2022, https://www.incontext.indiana.edu/2022/sept-oct/article2.asp
- Average annual growth rates are calculated using the compound annual growth rates.