Average wage growth across Indiana counties

During this period of high inflation, it will be increasingly important to stay informed on how well average wages are holding up over time.
Indiana’s average annual wage per job rose to $54,960 in 2021, ranking 34th in the U.S.1 After adjusting for inflation, this was a 1% increase over 2020 and a 6.3% increase over 2019. This article will explore how average wage growth varied by county.
The underlying wage data come from the Quarterly Census of Employment and Wages data set produced by the U.S. Bureau of Labor Statistics.2 The Indiana Business Research Center calculates the annual averages from these data and publishes them on STATS Indiana. Keep in mind that these are “wages per job.” In other words, the wages earned in a specific county are not necessarily taken home by a worker who resides in that same county (so don’t confuse this with county income). In addition, please note that all data used in this article are adjusted for inflation.
County-level average wage per job
The average annual wage across Indiana in 2021 ranged from $31,914 in Brown County to $72,065 in Martin County (thanks to the dominance of the Crane Naval Surface Warfare Center).
Only eight of Indiana’s 92 counties surpassed the statewide average of $54,960 (see Figure 1). In fact, more counties (13) are at least 25% below the state average than were above it.
Figure 1: Average annual wage per job, 2021
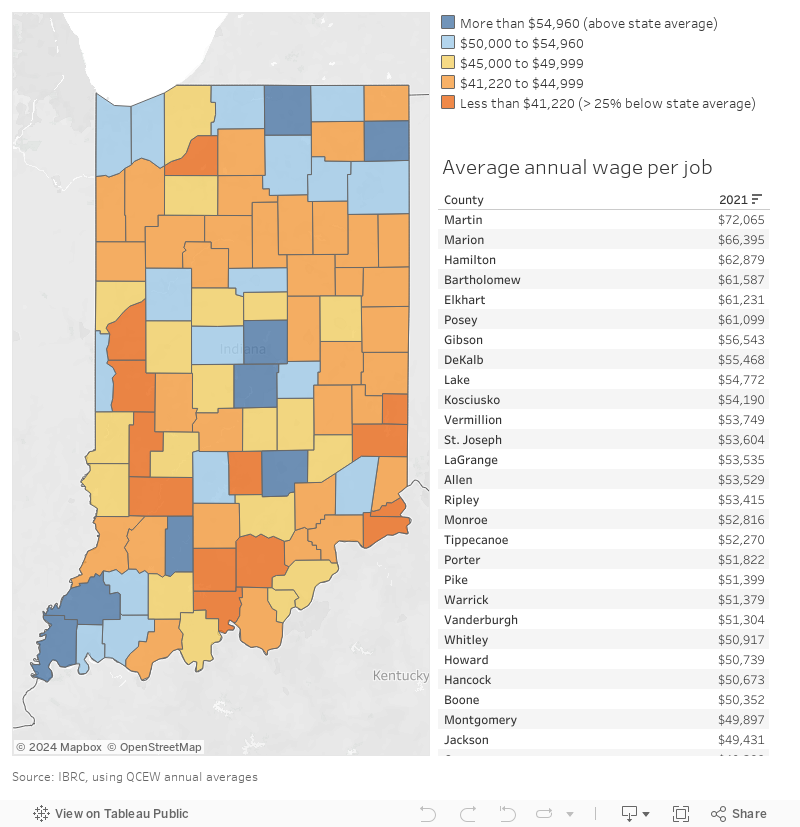
Figure 2 further illustrates that most counties are lagging the statewide average by a substantial margin.
Figure 2: County-level distribution of average wage per job, 2021
Source: IBRC, using QCEW annual averages
Wage growth over time
As a whole, Indiana experienced a 6.3% increase in average wage per job between 2019 and 2021. Elkhart and LaGrange counties led the state on this measure, each exceeding 15% growth. In all, 34 counties surpassed the state average increase. At the other end of the spectrum, 10 counties saw their real average wage per job decline once inflation was accounted for (see Figure 3).
Figure 3: Short-term change in average annual wage per job (adjusted for inflation), 2019 to 2021
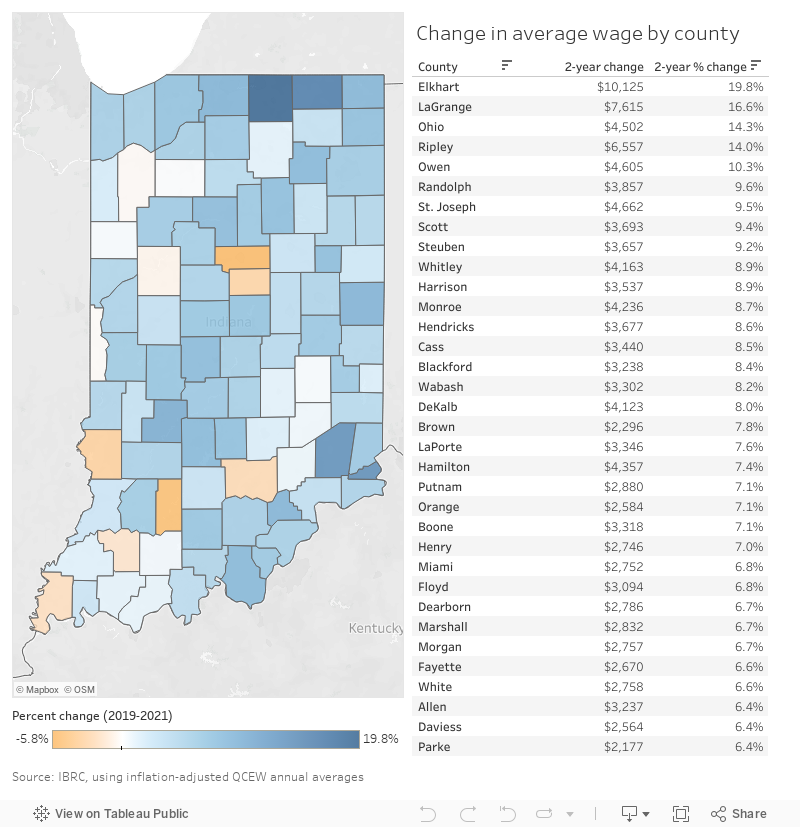
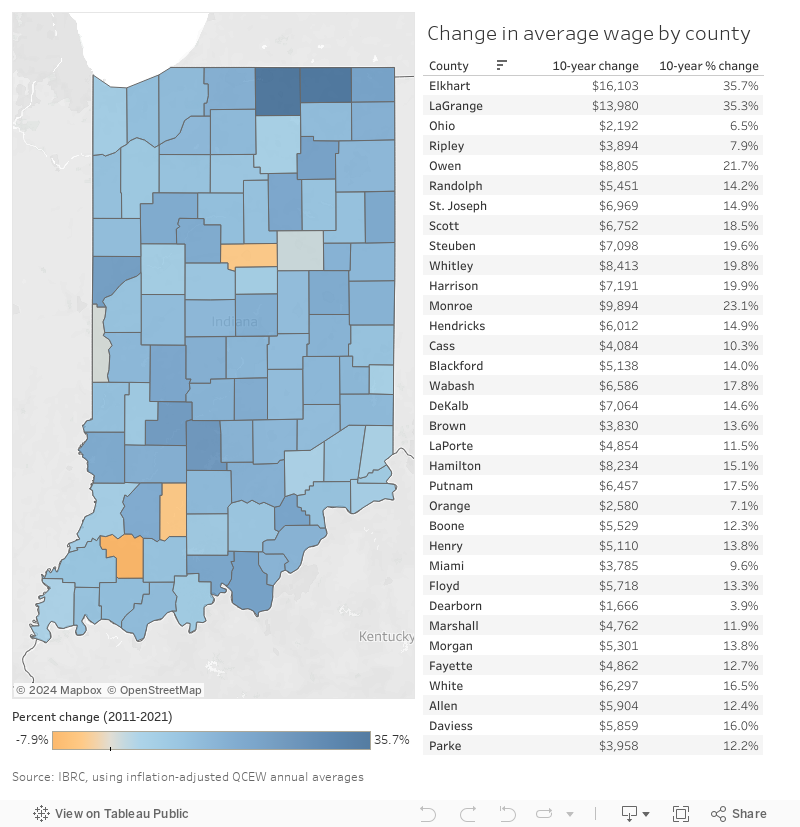
Figure 4 shows details regarding the long-term, 10-year change in average annual wage for all Indiana counties. Here we see a similar number of counties (31) surpassing the cumulative statewide average growth of 13.4%. Three counties (Pike, Martin and Howard) have average wages that have not kept up with inflation during this longer time frame.
Figure 4: Long-term change in average annual wage per job (adjusted for inflation), 2011 to 2021
Despite having the highest average wage in the state, Martin County is the only county among Indiana’s top 10 on this measure to see declines in average wage per job (after adjusting for inflation) for both the two-year (2019-2021) and 10-year (2011-2021) periods (see Table 1).
Table 1: Indiana counties with highest average annual wages: Top 10
| County | 2021 | 2-year percent change | 10-year percent change |
|---|---|---|---|
| Martin | $72,065 | -5.2% | -3.7% |
| Marion | $66,395 | 5.9% | 12.5% |
| Hamilton | $62,879 | 7.4% | 15.1% |
| Bartholomew | $61,587 | 1.5% | 12.4% |
| Elkhart | $61,231 | 19.8% | 35.7% |
| Posey | $61,099 | -1.9% | 3.7% |
| Gibson | $56,543 | 1.3% | 8.8% |
| DeKalb | $55,468 | 8.0% | 14.6% |
| Lake | $54,772 | 5.9% | 5.7% |
| Kosciusko | $54,190 | 1.1% | 4.6% |
Source: IBRC, using inflation-adjusted QCEW annual averages
Are the counties with the highest wages diverging from those with the lowest wages over time? One simple way to explore this question is to calculate the average for the top and bottom counties and compare the ratio. When doing so, we see that the spread between the highest and lowest counties is actually decreasing slightly over time (see Figure 5). The counties at the bottom of the list aren’t necessarily falling further behind the leaders—but they aren’t gaining that much ground either.
Figure 5: Highest and lowest average wages per job
Source: IBRC, using inflation-adjusted QCEW annual averages
As our economy continues to adapt to this current period of high inflation, it will be increasingly important for economic developers and policymakers to stay informed on how well average wages are holding up over time. The IBRC will continue to monitor this issue, and you can find all the current data on STATS Indiana’s Employment and Earnings page.
Notes
- View the inflation-adjusted data with rankings on StatsAmerica’s States in Profile.
- The fourth quarter data for 2021 used to calculate the annual averages are preliminary numbers.