The business of sports in the Hoosier state
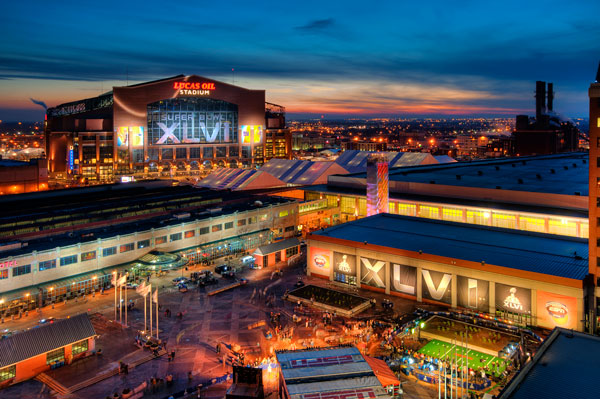
In recent years, Indianapolis has also developed a reputation for hosting large sporting events, including Super Bowl XLVI. Image credit @vistindy
“Welcome to Indiana basketball.”
Coach Norman Dale, played by Gene Hackman, utters this memorable line in the 1986 basketball classic Hoosiers, right before stepping out to coach his first game at fictional Hickory High School. The film, which Sports Illustrated ranks as the sixth-best sports movie of all time, is based on the real-life 1954 Milan High School basketball team, a group of scrappy underdogs from a small, rural school who pulled off a stunning upset to win the state championship. Forever immortalized in Hoosiers, the “Milan Miracle” made Indiana synonymous with basketball, but the state has a much richer sports heritage beyond the hardwood.
Due largely to the two-and-a-half-mile brick and asphalt track at Indianapolis Motor Speedway and the renowned 500-mile race run on its surface every May, the state also has a strong association with motor sports. Beyond that, Indianapolis also serves as the headquarters for several national governing bodies of sport, including the National Collegiate Athletic Association (NCAA), the National Federation of State High School Associations (NFHS), USA Gymnastics, USA Track & Field and USA Football.
In recent years, Indianapolis has also developed a reputation for hosting large sporting events, including the 2022 College Football Playoff National Championship, the entire 2021 NCAA Division I men’s basketball tournament and Super Bowl XLVI in 2012.1 The 2024 NBA All-Star Game will soon join this impressive list.
But where does the Hoosier state rank in terms of the number of professional teams that call it home?
Of the “Big Four” professional sports leagues, Indiana is only home to two – the NFL (Indianapolis Colts) and the NBA (Indiana Pacers).2 Since it ranks 17th in the nation in terms of its statewide population, Indiana falls about where you would expect when ranking states by the number of “Big Four” teams - tied with Maryland, Louisiana and Nevada for 20th place (Figure 1). In total, 24 states do not have any “Big Four” sports teams. Virginia is the most populous state without one (12th in population), followed by South Carolina (23rd) and Alabama (24th). Due to its relatively small population (it ranks 49th), the District of Columbia punches well above its weight with four “Big Four” teams, tied with six states for 8th place.3
Figure 1: Number of “Big Four” sports teams
Note: Canadian teams are not represented in this figure. There are seven NHL teams, one MLB team and one NBA team in Canada.
Source: Indiana Business Research Center
Table 1: "Big Four" sports teams by state and city
| State | City | NFL | MLB | NBA | NHL |
|---|---|---|---|---|---|
| Arizona Pop: 7,276,316 |
Glendale | Cardinals | Coyotes | ||
| Phoenix | Diamondbacks | Suns | |||
| California Pop: 39,237,836 |
Anaheim | Angels | Ducks | ||
| Inglewood | Chargers, Rams | ||||
| Los Angeles | Dodgers | Clippers, Lakers | Kings | ||
| Oakland | Athletics | ||||
| San Diego | Padres | ||||
| San Francisco | Giants | Warriors | |||
| Sacramento | Kings | ||||
| Santa Clara | 49ers | ||||
| San Jose | Sharks | ||||
| Colorado Pop: 5,812,069 |
Denver | Broncos | Rockies | Nuggets | Avalanche |
| District of Columbia Pop: 670,050 |
Washington, D.C. | Commanders | Nationals | Wizards | Capitals |
| Florida Pop: 21,781,128 |
Jacksonville | Jaguars | |||
| Miami Gardens | Dolphins | ||||
| Miami | Marlins | Heat | |||
| Orlando | Magic | ||||
| St. Petersburg | Rays | ||||
| Sunrise | Panthers | ||||
| Tampa | Buccaneers | Lightning | |||
| Georgia Pop: 10,799,566 |
Atlanta | Falcons | Hawks | ||
| Cumberland | Braves | ||||
| Illinois Pop: 12,671,469 |
Chicago | Bears | Cubs, White Sox | Bulls | Blackhawks |
| Indiana Pop: 6,805,985 |
Indianapolis | Colts | Pacers | ||
| Louisiana Pop: 4,624,047 |
New Orleans | Saints | Pelicans | ||
| Maryland Pop: 6,165,129 |
Baltimore | Ravens | Orioles | ||
| Massachusetts Pop: 6,984,723 |
Boston | Red Sox | Celtics | Bruins | |
| Foxborough | Patriots | ||||
| Michigan Pop: 10,050,811 |
Detroit | Lions | Tigers | Pistons | Red Wings |
| Minnesota Pop: 5,707,390 |
Minneapolis | Vikings | Twins | Timberwolves | |
| Saint Paul | Wild | ||||
| Missouri Pop: 6,168,187 |
Kansas City | Chiefs | Royals | ||
| Saint Louis | Cardinals | Blues | |||
| Nevada Pop: 3,143,991 |
Paradise | Raiders | Golden Knights | ||
| New Jersey Pop: 9,267,130 |
Newark | Devils | |||
| New York Pop: 19,835,913 |
Bronx | Yankees | |||
| Brooklyn | Nets | Islanders | |||
| Buffalo | Sabres | ||||
| New York City | Giants, Jets | Knicks | Rangers | ||
| Orchard Park | Bills | ||||
| Queens | Mets | ||||
| North Carolina Pop: 10,551,162 |
Charlotte | Panthers | Hornets | ||
| Raleigh | Hurricanes | ||||
| Ohio Pop: 11,780,017 |
Cincinnati | Bengals | Reds | ||
| Cleveland | Browns | Guardians | Cavaliers | ||
| Columbus | Blue Jackets | ||||
| Oklahoma Pop: 3,986,639 |
Oklahoma City | Thunder | |||
| Oregon Pop: 4,246,155 |
Portland | Trail Blazers | |||
| Pennsylvania Pop: 12,964,056 |
Philadelphia | Eagles | Phillies | 76ers | Flyers |
| Pittsburgh | Steelers | Pirates | Penguins | ||
| Tennessee Pop: 6,975,218 |
Memphis | Grizzlies | |||
| Nashville | Titans | Predators | |||
| Texas Pop: 29,527,941 |
Arlington | Cowboys | Rangers | ||
| Dallas | Mavericks | Stars | |||
| Houston | Texans | Astros | Rockets | ||
| San Antonio | Spurs | ||||
| Utah Pop: 3,337,975 |
Salt Lake City | Jazz | |||
| Washington Pop: 7,738,692 |
Seattle | Seahawks | Mariners | Kraken | |
| Wisconsin Pop: 5,895,908 |
Green Bay | Packers | |||
| Milwaukee | Brewers | Bucks |
Note: Canadian teams are not represented in this table. There are seven NHL teams, one MLB team and one NBA team in Canada. Population estimates: U.S. Census Bureau 2021.
Professional sports teams are businesses and employers and as such, they are part of the federal Census of Employment and Wages (CEW) data from the Bureau of Labor Statistics (BLS). This data can help us paint a picture of the business of sports in Indiana.
In the CEW data, sports teams fall under industry (NAICS) code 711211, which is defined as “professional or semiprofessional sports teams or clubs primarily engaged in participating in live sporting events…before a paying audience.”4 Digging deeper, we see that this includes a much wider array of sports with more niche followings, such as roller derby, boxing and jai alai.
When broadening the definition of sports teams to include semiprofessional teams and clubs, sports outside of the “Big Four” and women’s teams, Indiana performs roughly the same. With 55 teams, the Hoosier state ranks 18th in terms of the number of CEW-defined teams (Figure 2). While the top three states (California, Florida and Texas) are no surprise based on population, Massachusetts and Minnesota, which are ranked 15th and 22nd in population respectively, close out the top five. Although it has no “Big Four” teams, Virginia has the ninth-most CEW-defined teams, coming in with 92. It is important to note that all 50 states and Washington D.C. have at least six sports teams or clubs that fall under NAICS 711211.
Figure 2: Number of professional and semi-professional sports teams (CEW data)
Source: Indiana Business Research Center, using Bureau of Labor Statistics Census of Employment and Wages data (NAICS 711211) for 2021
Although the number of teams in Indiana may not turn any heads, the business of professional sports in Indiana, perhaps unsurprisingly, is big money. This is where the CEW data becomes immensely helpful, as it provides both employment and quarterly payroll numbers. In Indiana, quarterly payroll figures for this industry often exceed 100 million dollars. Looking at the quarterly payroll numbers is fascinating because it highlights several attributing factors:
- The seasonality of sports
- The number of athletes per team
- The average pay per sport
As is evidenced in Figure 3, the fourth quarter of every year sees a spike in payroll for Indiana. This is likely due to the seasonality of football. In other words, when the Indianapolis Colts are in season, payroll spikes. This is partially due to the high average salary of an NFL player (around $2.7 million in 2017), but it is also due to the number of players on a football team. There are 53 players on an NFL active roster, whereas baseball teams have 26, hockey teams have 23 and basketball teams have 17.5
Figure 3: Indiana employment and payroll for professional sports teams since 2018
Note: “Professional sports teams” is defined as CEW data for NAICS 711211. Quarter 1 data for 2022 is preliminary data.
Source: Bureau of Labor Statistics Census of Employment and Wages data (NAICS 711211)
Based on this information, it follows that the fourth quarter in Indiana, when both the Colts and Pacers are playing, would see a spike in payroll. The NFL season typically runs from September to January (excluding the preseason and playoff appearances) and the NBA season typically runs from October to April (excluding playoff appearances). Although the average NBA player makes more money (an average NBA salary for the 2021-22 season was $8.5 million), there are far fewer players on the team.
In the summer months, Indiana’s “Big Four” teams are not in season, but there are several minor league baseball teams in full swing (pun intended), including the Indianapolis Indians, the Fort Wayne Tincaps and the South Bend Cubs. These teams account for the increased employment numbers in the second and third quarters of each year since baseball season typically runs from April to September (excluding playoff appearances).
It is also prudent to note that the COVID-19 pandemic had a massive impact on the sports industry – one that could warrant an article of its own. The entire 2020 minor league baseball season was canceled due to the pandemic, which is clearly reflected in the employment numbers in Figure 3. Although the NFL started its 2020 season on time, the NBA opted for a reduced-length season that began in December.
These insights merely scratch the surface of what can be gleaned from CEW data about the business of sports in the Hoosier state. Indiana motor sports and sports governing bodies weren’t discussed in this article, but were the focus of a study released in December 2021 by the Indiana Economic Development Corporation.
Notes
- Normally, the NCAA Division I men’s basketball tournament (or “March Madness”) is split into four regions played in twelve different cities (for the first and second rounds), as well as “First Four” games played in Dayton, Ohio and “Final Four” games played in a different host city every year. Due to the ongoing COVID-19 pandemic, however, Indiana was chosen as the first-ever single state to host the entire tournament in 2021, with games played at different sites throughout the state, including Bloomington, West Lafayette and Indianapolis.
- The “Big Four” professional sports leagues are the National Football League (NFL), National Basketball Association (NBA), Major League Baseball (MLB) and National Hockey League (NHL).
- For our purposes, we are considering the Washington Commanders of the NFL as part of the District of Columbia, despite the fact that FedExField is in Maryland. We are also considering the New York Giants and New York Jets as part of New York, although they both play in New Jersey.
- The definition for NAICS code 711211 also says, “These establishments may or may not operate their own arena, stadium or other facility for presenting these events.”
- NBA teams have 15 players on an “official” roster, but can add two more “two-way” players that typically play for G-League affiliates. These players are available to be called up to the NBA team due to extenuating circumstances (such as injuries). In the postseason, NBA teams are allowed up to 20 players on active rosters.