Indiana's Ag Economy
A drive into Indiana’s countryside quickly reveals fields of row crops, pastures filled with livestock, and farms with barns and equipment scattered about. Along the journey, one would likely pass several forests of tall, towering trees. All of this and more encompasses Indiana’s agriculture industry. Visually, it’s easy to see and appreciate the state’s rich agricultural heritage, but understanding the industry of agriculture and its economic impact is more challenging.
The agriculture industry involves more than production agriculture, such as raising livestock or growing crops. It also includes manufacturing, wholesale, storage, support services, tourism and retail operations. Agriculture is entwined in every aspect of our lives through the basic essentials of food, clothing and shelter. This article highlights the findings of the Indiana Business Research Center’s (IBRC) recent economic impact study on Indiana’s agriculture industry1 to inform readers about the current state of the state’s agriculture economy.
Why an Economic Impact Study?
Prior to the Agriculture’s Bounty report, agricultural agencies used a compilation of statistics from reputable agencies or independent research groups to describe the economic presence of the state’s agriculture industry.2 This provided a disjointed picture of the overall agriculture economy. The Indiana Soybean Alliance (ISA) asked the IBRC to create a digestible and comprehensive account of the economic impact the agriculture industry has upon the state using data from the U.S. Department of Agriculture’s (USDA) National Agriculture Statistics Service (NASS).
The Ripple Effect
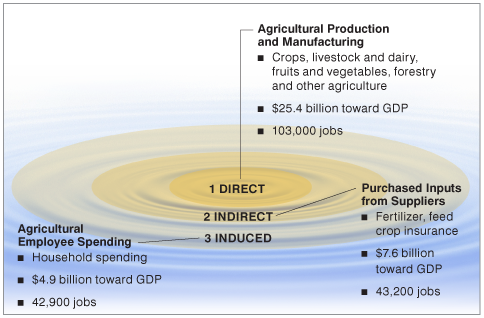
It is estimated that Indiana’s agriculture industry contributed $37.9 billion in economic output and supported nearly 190,000 Hoosier jobs in 2011 (see Figure 1).
-
The production of crops, livestock and wood products as well as the manufacture of processed agricultural goods (otherwise known as the direct effect) comprised the largest share of the economic output. Ripple 1: $25.4 billion and 103,000 jobs.
-
Similar to the phenomenon of dropping a pebble into a pool of water, the agriculture production and manufacturing activity caused a ripple effect of economic activity across the state. The second ripple (indirect effect) includes the purchased inputs from suppliers that sustain farms and agricultural manufacturing businesses, such as the purchase of seed, feed, fertilizers, crop insurance and equipment. Ripple 2: $7.6 billion in economic output and 43,200 jobs.
-
The third ripple (induced effect) captures the household spending of employees working at farms or other agricultural firms represented in the initial and secondary ripple effects. Ripple 3: $4.9 billion in economic output and 42,900 jobs.
Figure 1: Economic Ripple Effect of Indiana Agriculture and Forestry, 2011
Source: IBRC, using WISER Trade and NASS data from the USDA
Another measure of overall economic impact is the use of a multiplier. A multiplier is defined to be a measure of the magnitude of the economic response in a particular geographic region associated with a change in the direct effects. For the agricultural production and manufacturing industry, the multiplier was 1.49, meaning that every dollar of output supported $0.49 in additional economic activity within the state (see Table 1). In terms of employment, the multiplier (ratio of total employment effects to direct employment) was 1.84. This means that for every 100 jobs directly related to Indiana agriculture and manufacturing industries, another 84 jobs were supported in the state.
Table 1: The Economic Contributions of Agriculture and Forestry to Indiana’s Economy, 2011
| Category | Direct Effects | Indirect Effects | Induced Effects | Total | Multiplier |
|---|---|---|---|---|---|
| Total Output (in millions) | |||||
| All Agriculture and Forestry | $25,401 | $7,581 | $4,911 | $37,893 | 1.49 |
| Production | $12,247 | $4,293 | $3,002 | $19,542 | 1.60 |
| Processing and Manufacturing | $13,154 | $3,288 | $1,909 | $18,351 | 1.40 |
| Value Added (in millions) | |||||
| All Agriculture and Forestry | $5,661 | $4,189 | $2,987 | $12,837 | 2.27 |
| Production | $3,935 | $2,243 | $1,827 | $8,005 | 2.03 |
| Processing and Manufacturing | $1,725 | $1,947 | $1,160 | $4,832 | 2.80 |
| Employment | |||||
| All Agriculture and Forestry | 102,700 | 43,200 | 42,900 | 188,800 | 1.84 |
| Production | 82,000 | 20,100 | 24,800 | 126,900 | 1.55 |
| Processing and Manufacturing | 20,700 | 23,100 | 18,100 | 61,900 | 2.99 |
Source: IBRC, using data from the USDA and the IMPLAN economic modeling software
Value Added
While the economic output numbers are impressive, keep in mind that these numbers do not account for the expenditures associated with creating these outputs. Value added (otherwise known as GDP) is the difference between an industry’s total output and the cost of its production inputs. It consists of four components: employee compensation, proprietor income, other property tax and indirect business tax.
Indiana’s agriculture and forestry-related establishments combined to generate an estimated $5.7 billion in direct value added (see Table 1). This activity sparked an additional $7.2 billion in indirect and induced effects throughout the state to bring the industry’s total value added impact to nearly $13 billion. Compared to the state’s total value added (GDP) of $267 billion, the combined effects of agriculture and forestry accounted for nearly 5 percent of Indiana’s GDP in 2011.
Which Agriculture Industries Have the Most Impact?
The logical next question is, which agriculture industries contributed most to these economic impact numbers? Table 2 outlines the top five industries in both employment and contribution to the state’s GDP (value-added).3 As anticipated, grain farming, oilseed farming, and hogs and other animal production garnered the top three places. This is due, in part, to these industries having the top three production values in 2011. Rounding out the top five were wet corn milling and animal processing (except poultry).
Together, the top five industries were responsible for supporting approximately 67 percent of additional employment and 63 percent of the total value added to the state’s GDP. Wet corn milling had the largest multiplier of all the agriculture and forestry industries in both employment and value added at 10.35 and 4.0, respectively. Recognizing that wet corn milling includes the production of corn starch, high fructose corn syrup, animal feed and ethanol—most of which are ingredients in other manufactured items—it makes sense that it has such an impressive ripple effect.
Table 2: Agriculture and Forestry’s Contribution to Indiana Employment and Value Added, Top 5 Industries, 2011
| Category | Direct Effect | Ripple Effects* | Total | Multiplier |
|---|---|---|---|---|
| Grain Farming | ||||
| Employment | 37,170 | 17,680 | 54,850 | 1.48 |
| Value Added (in millions) | $1,182 | $2,030 | $3,212 | 2.72 |
| Oilseed Farming | ||||
| Employment | 17,190 | 12,110 | 29,300 | 1.70 |
| Value Added (in millions) | $1,184 | $920 | $2,104 | 1.78 |
| Hogs and Other Animal Production# | ||||
| Employment | 13,730 | 3,200 | 16,930 | 1.23 |
| Value Added (in millions) | $537 | $245 | $782 | 1.46 |
| Wet Corn Milling | ||||
| Employment | 1,270 | 11,880 | 13,150 | 10.35 |
| Value Added (in millions) | $314 | $942 | $1,257 | 4.00 |
| Animal Processing (Except Poultry) | ||||
| Employment | 5,910 | 7,040 | 12,950 | 2.19 |
| Value Added (in millions) | $269 | $494 | $763 | 2.84 |
| Total (All Agriculture and Forestry Industries) | ||||
| Employment | 102,760 | 86,130 | 188,890 | 1.84 |
| Value Added (in millions) | $5,661 | $7,176 | $12,837 | 2.27 |
* Ripple effects refer to both indirect and induced effects.
# “Other animal production” refers to sheep, goats, aquaculture, etc. Cattle and poultry production are separate industries.
Source: IBRC, using data from the USDA and the IMPLAN economic modeling software
How Do These Results Compare to Past Statistics?
A common question received after the report was released was, “how do these results compare to past reports—is Indiana agriculture growing?” Unfortunately, there is not another agriculture economic impact study that allows us to directly compare past numbers with these data. And if one looks at the data that are available, methodology differences alter which industries are considered agriculture and forestry—which can greatly skew the numbers.
However, with this in mind, the Indiana State Department of Agriculture had several talking points they utilized during Governor Daniel’s first administration that can be used as a reference point. It was stated that approximately $25 billion was added to Indiana’s economy from farm, food and forestry products—this report shows $37.9 billion, a 52 percent difference.
A 2005 report by BioCrossroads estimated that agriculture had a $10 billion multiplier effect on local economies (determined by multiplying the multiplier with the 2003 wages by agriculture industry). It implied that for every dollar in direct wages and income from farm, food and forestry workers, more than 2.5 times that amount flowed back into the local economy.4 The current report did not attach wages to the multiplier effects, so a comparison cannot be made.
Based on the few comparison points, one would argue that the state’s agriculture and forestry industry has increased its economic footprint since the mid-2000s. A cynic may retort that the increase is due to high commodity prices—hence the economic impact numbers are inflated. While it is true that the prices received for commodity goods have dramatically increased in the past decade and that farmers have enjoyed particularly good prices in the past two years alone, the expenditures associated with producing the commodities to garner those prices have increased dramatically as well.5
Despite the increase in commodity prices, production of raw agricultural products has not increased unilaterally across all categories. Production quantities actually decreased in the past five years (2006-2011) for several commodities, such as soybeans and cattle and calves (16.2 percent and 22.6 percent, respectively). Soybean production declined due to fewer acres planted (however, corn production dropped slightly as well 1.4 percent) and drops in yield due to persistent plant and pest diseases. Cattle production numbers have declined due to soft demand, higher feed prices and drops in number of cattle raised.
On the other hand, pork production has seen a strong increase (18.2 percent) as well as other animal production (45.9 percent), which primarily covers aquaculture. Pork production has enjoyed strong state support with its initiative to increase pork production. The aquaculture industry has grown rapidly in the past five years, thanks in part to strong expansions at Bell Aquaculture in southern Indiana.
Summary
As Hoosiers continue on their countryside journey, hopefully they will also realize the great economic contribution that Indiana agriculture brings to the state. It is understandable why Indiana’s agricultural industries have been encouraged to expand in the past decade—with $37.9 billion in total economic output, leading to approximately $13 billion in value added to the state’s GDP while supporting approximately 190,000 jobs. The state’s agriculture and forestry industry future is very bright, and it continues to have strong support from the new governor. Opportunities have been identified on how to leverage the state’s agriculture expertise for additional future economic growth.6
In the meantime, agriculture production will maintain its ebb and flow despite potential setbacks due to weather conditions or forecasted commodity price drops. Agricultural technology will continue to change the productivity levels of raw commodity products such as increased crop yields and better livestock genetics. Our forests will continue to be re-populated to maintain sustainable logging practices. And Hoosiers who farm or don’t farm will remain in awe of the acres upon acres of our agricultural bounty.
Notes
- Indiana Business Research Center, “Agriculture’s Bounty: The Economic Contribution of Agriculture,” May 2013, www.ibrc.indiana.edu/studies/AgriculturesBounty.pdf.
- Examples of these agencies and research groups include but are not limited to: U.S. Census Bureau; USDA’s National Agricultural Statistics Service, Economic Research Service and Forest Service; BioCrossroad’s 2005 and 2012 agriculture reports; Indiana’s Hardwood Association; and Purdue University’s College of Agriculture.
- The report outlines the top 15 in each category separately. For the sake of brevity, the top five were chosen for this article.
- BioCrossroads, “Find Out What We’re Made Of: A Strategic Plan for Indiana’s Agricultural Economy 2005,” January 2005, www.biointellex.com/find-made-strategic-plan-indianas-agricultural-econo/.
- Since January 2003, the prices received for all crops have increased by 123.5 percent, by 75 percent for livestock products and by 103 percent for all agricultural products.
- Examples of these opportunities include Governor Pence’s initiative to create a Food and Agriculture Innovation Corridor that piggybacks on the 2012 BioCrossroads report identifying ways that Indiana could leverage the agricultural research and expertise into innovative collaborations.