Population Growth Continues to Slow Amid Sluggish Economic Recovery
Nearly three years after the end of the Great Recession, many key measures of the economy are showing slow but real improvements. However, slow population growth around the country—an important side effect of the economic downturn—does not show any signs of turning around. In fact, the U.S. Census Bureau recently reported that between 2010 and 2011, the U.S. had its lowest annual rate of population growth since the mid-1940s.
Here in Indiana, the population increased by 26,300 residents in 2011—a 0.4 percent increase. This was the state’s lowest one-year growth rate since 1988. As Table 1 shows, Indiana’s rate of growth in 2011 was only two-thirds as quick as its pace between 2000 and 2010. In all, 43 states had a slower rate of change in 2011 than they averaged over the previous decade. Some of the most dramatic declines were in once booming states. Nevada, for instance, was the nation’s fastest growing state last decade yet its 2011 pace ranked 25th. Arizona grew at just half the rate it did between 2000 and 2010.
Table 1: 2011 Population Growth Rate Compared to 2000 to 2010 Annual Average, Select States
| State | Average Annual Percentage Change, 2000 to 2010 | Percentage Change, 2010 to 2011 |
2000 to 2010 Rank |
2010 to 2011 Rank |
|---|---|---|---|---|
| Nevada | 3.1% | 0.7% | 1 | 25 |
| Arizona | 2.2% | 1.1% | 2 | 9 |
| Texas | 1.9% | 1.7% | 5 | 2 |
| Florida | 1.6% | 1.2% | 8 | 8 |
| Kentucky | 0.7% | 0.5% | 28 | 31 |
| Indiana | 0.6% | 0.4% | 31 | 34 |
| Illinois | 0.3% | 0.2% | 43 | 42 |
| Ohio | 0.2% | 0.1% | 48 | 48 |
| Michigan | -0.1% | -0.01% | 51 | 50 |
| United States | 0.9% | 0.7% | n/a | n/a |
Source: IBRC, using U.S. Census Bureau population estimates
Like last decade, Indiana’s 2011 growth rate outpaced neighboring Illinois, Ohio and Michigan but trailed Kentucky (see Figure 1). Michigan was the only state to lose population between 2000 and 2010. It lost population last year too, but not as quickly.
Figure 1: Population Change by State, 2010 to 2011
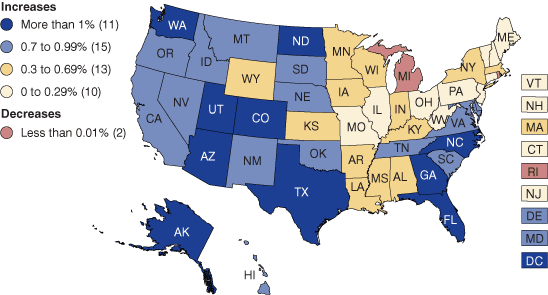
Source: IBRC, using U.S. Census Bureau population estimates
Low levels of migration account for much of this slowdown. At the national level, the most striking shift in recent years is that net migration between Mexico and the U.S. is essentially at zero according to the Pew Hispanic Center.1 Mexico has long been the nation’s largest source of immigration but that flow has come to a stop for now.
Since the onset of the recession, migration between states is down as well. For instance, 35 states had a net in-migration of residents between 2003 and 2007. Of these states, only eight had a net inflow in 2011 that exceeded their annual average over this pre-recession period. By contrast, in 2011, fewer people moved away from 12 of the 16 states that had an average annual net outflow of residents between 2003 and 2007. These trends suggest an overall dampening of movement around the country in the wake of the recession.
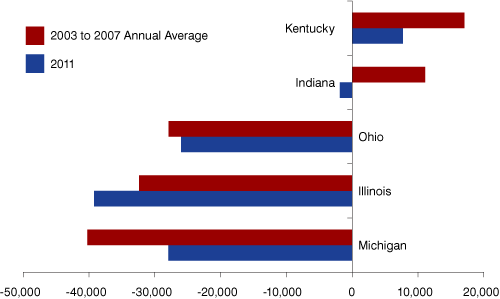
Indiana averaged a net in-migration of 11,100 residents per year over this pre-recession period but had a net outflow of nearly 1,900 in 2011 (see Figure 2). This is only the third time since 1990 that the state had a one-year net out-migration of population.2 Michigan and Ohio are two examples of states that lost a lot of population through migration during the mid-2000s but saw fewer residents leave on average in 2011.
Figure 2: 2011 Net Migration Compared to 2003 to 2007 Annual Average, Select States
Source: Indiana Business Research Center, using U.S. Census Bureau population estimates
Around Indiana
The economic downturn has altered population trends within Indiana as well. In 2011, Marion, Hamilton, Allen and Hendricks counties posted the largest population increases among Indiana counties. However, the growth in Hamilton and Hendricks counties was well below their annual averages over the previous decade. Hamilton County added 6,358 residents in 2011 compared to an average annual increase of 9,183 from 2000 to 2010. Hendricks County's population grew by 2,113 last year compared to 4,136 per year over the previous decade.
In contrast, Marion County's population growth of 6,507 residents in 2011 was well above its average annual increase of 4,294 over the past decade. An accelerated pace of growth in 2011 was rare among Indiana's larger counties, however. Of the 20 counties that led the state in average annual population growth last decade, only three—Marion, Allen and Bartholomew—had an increase in 2011 that exceeded their average mark from 2000 to 2010.
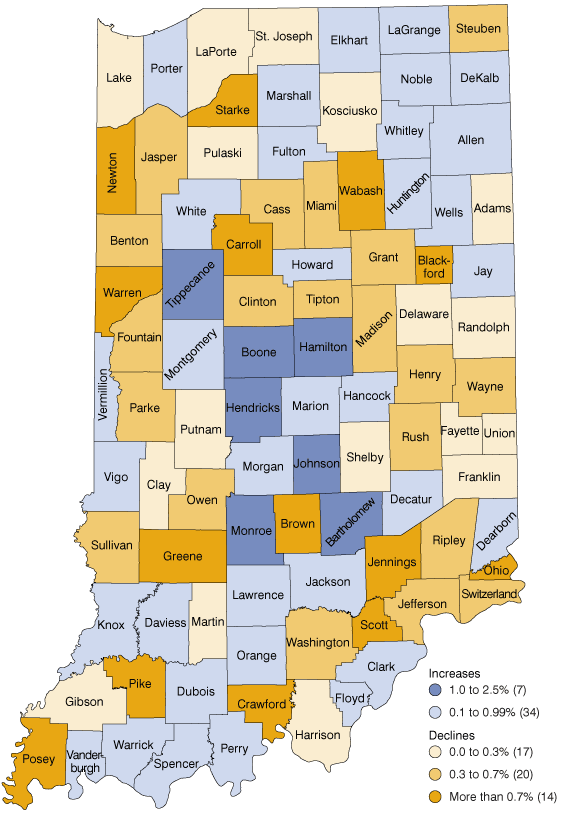
Even though growth was down in many suburban areas in 2011, Hamilton County (2.3 percent population increase) and Hendricks County (1.4 percent) were still the state’s fastest growing counties. In all, the 10-county Indianapolis-Carmel metro area accounted for 67 percent of the state's total population growth last year. Outside of central Indiana, Bartholomew County had the quickest pace of growth at 1.3 percent, which ranked as the state's third-fastest growth rate in 2011 (see Figure 3).
Figure 3: Population Change by County, 2010 to 2011
Source: Indiana Business Research Center, using U.S. Census Bureau population estimates
Fifty-one of Indiana's 92 counties lost population last year. According to past Census Bureau estimates, this is the largest number of Indiana counties to post a one-year decline since 1986, when 57 counties lost population. Lake County had the state's largest population decline in 2011 at 572 residents, followed by Madison County (-417), Greene County (-290) and Jennings County (-283). As for the pace of decline, Blackford County had the highest rate of population loss last year at 1.3 percent, followed by Jennings (-1.0 percent), Pike (-0.9 percent) and Greene (-0.9 percent) counties.
Migration to the Suburbs Slows
Just as migration between states has slowed, so too has migration within many large metro areas. Figure 4 compares the 2011 net migration estimates for the suburban counties of the Indianapolis metro area along with the large metros that border the state against their average annual levels before the recession. The nine suburban counties of the Indianapolis area averaged a net in-migration of roughly 15,400 residents a year between 2003 and 2007.3 However, the net influx dropped to 6,200 in 2011—a 60 percent decrease. Within the area, Hamilton County had the largest drop—going from an annual average of 7,600 net in-migrants between 2003 and 2007 to 3,800 in 2011. Comparing the same periods, the net in-migration marks for Hendricks and Johnson counties were down 2,000 residents and 1,200 residents, respectively.
Figure 4: 2011 Net Migration Estimates for Suburban Counties of Select Metro Areas
Source: Indiana Business Research Center, using U.S. Census Bureau population estimates
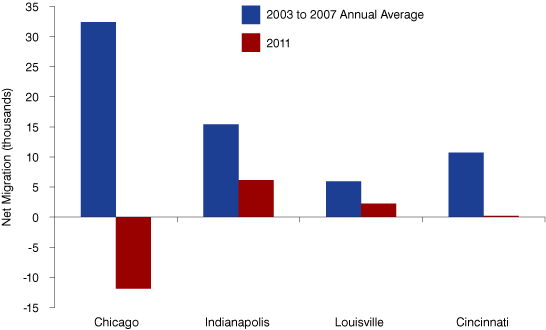
The 13 outlying counties of the Chicago metro area (which include Lake, Porter, Jasper and Newton counties in Indiana) have shown an even more dramatic fall in migration. These 13 counties combined to average a net in-migration of 32,000 residents a year between 2003 and 2007 yet had a large net out-migration in 2011. Of this group, Indiana’s Lake County had the second-largest 2011 net out-migration at roughly 2,500 residents. Net migration in the Louisville and Cincinnati suburbs, which also include Indiana counties, is down since the recession too.
Meanwhile, many of the core urban counties of these metros have seen marked improvements in their net migration figures since the downturn as the flow of residents to suburban areas or to other fast-growing regions of the country slowed. Marion County, for instance, averaged a net out-migration of 4,200 residents per year between 2003 and 2007 but that outflow slowed to 1,300 residents in 2011. Between the same periods, net out-migration from Cook County, Illinois (Chicago) slowed from an average of 62,600 per year to 17,600.
Slower Growth among All Large Racial and Ethnic Groups
The Hispanic population showed the largest growth of any race or ethnic group in the state with roughly 11,560 new residents added from 2010 to 2011. This change was two-and-a-half times greater than the black population's increase of 4,620 residents—the second-largest increase of any racial or ethnic group in Indiana.4 The state's non-Hispanic white population increased by 4,340 in the past year, while the Asian population added 3,020 residents. The Hispanic population alone accounted for 44 percent of Indiana's total growth in 2011.
The growth in each of these groups was much lower than their average annual increase from 2000 to 2010. Indiana's Hispanic population grew by an average of 17,510 residents per year in the past decade, while the black population averaged 7,660 new residents per year. Over the same period, the state's white and Asian populations grew by an average of 6,430 and 4,320 residents per year, respectively.
Because of the state's varying growth trends in recent years, Indiana has become more diverse. The non-Hispanic white population's share of Indiana's total dropped to 81.3 percent in 2011 from 86 percent in 2000. Over the same period, the state's black population climbed from 8.4 percent of the total to 9.1 percent. Indiana's Hispanic residents now account for 6.2 percent of the state's population, compared to 3.5 percent in 2000.
While Indiana's racial and ethnic makeup has shifted, the state remains less diverse than the nation. The share of Indiana's population that is non-Hispanic white is well above the U.S. mark of 63.4 percent. Also, the share of the U.S. population that is Hispanic is nearly three times greater than the Indiana mark.
Greater Diversity in Youth Population
The nature of the growth within the state's child population underscores Indiana's growing racial and ethnic diversity. In 2011, the number of non-Hispanic white residents younger than 18 dropped by 1 percent. This rate of change equates to a decline of 11,460 white children in the past year. The number of black children in the state fell by 1,480 from 2010 to 2011—a 0.8 percent decline.
By contrast, the Hispanic population younger than 18 increased by 3,720 (2.4 percent increase), and the number of Asian children grew by 810 residents (3.2 percent). In all, the state's total child population dropped by roughly 7,700 residents in 2011—down 0.5 percent from 2010.
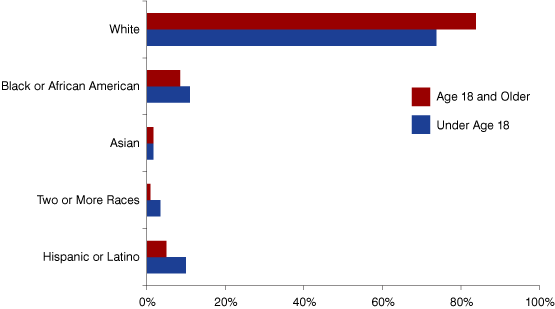
Because of its strong growth in the younger age groups, Hispanic residents now account for 9.9 percent of the total Indiana child population, compared to 5 percent of the state's population age 18 or older (see Figure 5). By contrast, non-Hispanic white residents make up 73.7 percent of the state's population younger than 18, compared to 83.8 percent of the adult population. Indiana's black residents account for 11 percent of the child population and 8.5 percent of the adult population. For more population estimates data for Indiana and the country, please visit www.stats.indiana.edu/topic/population.asp.
Figure 5: Share of Indiana Population by Age Group, Race and Ethnicity, 2011
Source: Indiana Business Research Center, using U.S. Census Bureau population estimates
Notes
- Jeffrey Passel, D’Vera Cohn and Ana Gonzalez-Barrera, “Net Migration from Mexico Falls to Zero—and Perhaps Less,” Pew Hispanic Center, May 2012, www.pewhispanic.org/2012/04/23/net-migration-from-mexico-falls-to-zero-and-perhaps-less/.
- The other years were 2002 and 2010. In years like 2010 when the Census Bureau conducts a decennial census, they publish estimates for only a portion of that year.
- In the case of the Indianapolis metro area, the suburban counties are Boone, Brown, Hamilton, Hancock, Hendricks, Johnson, Morgan, Putnam and Shelby. Marion County is the metro area's core county and is excluded from these numbers.
- Hispanic is an ethnicity, not a race. Hispanic residents may be of any race. All references to race groups in this release exclude Hispanic residents of that race.
Matt Kinghorn
Demographer, Indiana Business Research Center, Indiana University Kelley School of Business