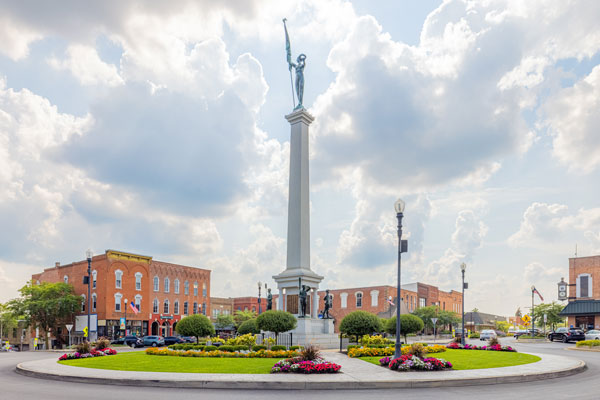
Middle of the pack: A Steuben County spotlight
Per capita personal income in Steuben County increased by 32% between 2017 and 2022.
There are 92 counties in Indiana and arguably, each is unique. Each has a different combination of physical features and population size. Based on the 2023 population estimates, which county is considered Indiana’s “median,” or middle, in terms of its population size and rank? That would be Steuben County, located in the northeast corner of the state, ranking 46th out of 92 counties in population size, and one of 11 counties in Economic Growth Region 3 (EGR 3).
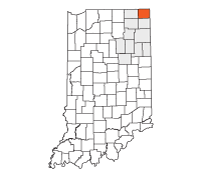
Steuben County is located in the northeast corner of Indiana.
EGR 3 consists of Adams, Allen, DeKalb, Grant, Huntington, LaGrange, Noble, Steuben, Wabash, Wells and Whitley counties.
Since 2010, Steuben County’s population has grown 2.3%, lagging the state’s growth of 5.8%. However, both pale in comparison to nearby Allen County, which has grown 11% since 2010.1
Considering its population size, Steuben County performs quite well in terms of personal income when compared to the region and the state. Looking at per capita personal income (PCPI) data from the U.S. Bureau of Economic Analysis, Steuben County has seen similar growth to the state from 2017 to 2022. PCPI has increased in Steuben County from $41,457 in 2017 (pre-pandemic) to $54,649 in 2022 (post-pandemic). That’s a growth of 32% for the county, and while the state has a higher PCPI, it experienced similar growth, with PCPI at $44,570 in 2017 and $58,973 in 2022. Steuben boasted a higher PCPI than EGR 3 in 2022, slightly besting its PCPI of $54,572.2
Steuben County is not part of the Fort Wayne metropolitan statistical area, so the typical trends of urbanization are not realized. The county relies heavily on the education and knowledge creation industry cluster, which ranks third in industry employment after local hospitality establishments and local health services.3 This is largely attributed to Trine University. Livestock processing also ranks much higher in Steuben County than it does for the region or the state.
Steuben County is expected to see a 12% drop in its total labor force by 2050.4 Most of Steuben County’s labor force age brackets are expected to decrease by 2050, with age 65 and older showing a slight gain (see Figure 1). In contrast, the region and the state both show increases in the labor force for all age groups except for those ages 16 to 24 (see Figure 2). Millennials are certainly the core of Indiana’s labor force over the next 26 years and Steuben County appears to be losing the retention battle for that age group.
Interactive Figure 1: Steuben County labor force projections

Interactive Figure 2: Economic Growth Region 3 labor force projections

Though they are both located in the northeast corner of the state, Steuben and Whitley counties display significant differences in commuting and educational attainment. Whitley County relies heavily on Allen County and the Fort Wayne MSA, sending much of its labor supply there for work (27% of its employed workers in 2020 as opposed to only 7% for Steuben County).
In fact, slightly less than half of Whitley County residents work in the county where they live (49.7%), while 65.2% of Steuben County residents work in their home county.5 Another, perhaps hypothetical, effect of being situated near an MSA relates to educational attainment. Whitley County boasts higher percentages of adults with associate and bachelor’s degrees, with 11.8% and 16.7%, respectively, in 2022. Steuben County, on the other hand, had 8.6% of adults with an associate degree and 15.9% with a bachelor’s degree.6
In terms of innovation, Steuben County again fares well. StatsAmerica’s Innovation Intelligence tool gives Steuben a moderate rating for human capital and knowledge creation, business dynamics, business profile and employment and productivity. The county receives a high rating for economic well-being. In fact, Steuben County outperforms the state in every sub-index with the exception of business profile.7
Steuben County residents, like those in many other Indiana counties, love their local sports. Angola High School, with a 2024 enrollment of 741, is not necessarily a small school, but comes in much smaller than those in the nearby Fort Wayne MSA.8 Across the county is Fremont High School, with a smaller 2024 enrollment of 283 students. However, high school sports are not the only athletics in the county. The aforementioned Trine University is a Division III school in the NCAA and the Thunder recently won the 2024 men’s basketball DIII championship.
There is a big caveat in Steuben being Indiana’s middle (median) county. This is based on 2023 population estimates and given the projected population changes, Steuben is likely to move down in the rankings by size of population and be surpassed by Whitley County (see Figure 3). Statewide population growth is primarily in metro areas. Declining population for most rural counties will continue to move the goal post, and although Steuben County fares well in regards to economics, innovation and sports, it is not the most practical way to gauge the pulse of the state.
Interactive Figure 3: Steuben County population projections

Roughly one third of Indiana’s labor force currently resides in the Indianapolis metropolitan area. The Fort Wayne metro dominates the northeast region in terms of population growth. Like most rural counties, Steuben has generally lower wages, differences in dominant industries and a lower percentage of adults with advanced educational attainment. However, Steuben is well positioned geographically and, with development and attraction efforts aimed at the tri-state area (Indiana, Michigan and Ohio borders), it has an advantage for growth and development.
Notes
- Population over time, time series mode. STATS Indiana. https://www.stats.indiana.edu/dms4/new_dpage.asp?profile_id=304&output_mode=2.
- Demographic report on the Regionizer. Hoosiers by the Numbers. https://www.hoosierdata.in.gov/rb/default.aspx.
- Industry clusters on the Regionizer. Hoosiers by the Numbers. https://www.hoosierdata.in.gov/rb/default.aspx.
- Labor force projections, released in July 2024 by the Indiana Business Research Center. Hoosiers by the Numbers. https://www.hoosierdata.in.gov/labor_proj/.
- Commuting detail on the Regionizer. Hoosiers by the Numbers. https://www.hoosierdata.in.gov/rb/default.aspx.
- Demographic report on the Regionizer. Hoosiers by the Numbers. https://www.hoosierdata.in.gov/rb/default.aspx.
- Innovation Intelligence. StatsAmerica. Indiana Business Research Center. https://www.statsamerica.org/innovation2/ii3.aspx.
- School enrollment by grade level, Indiana Department of Education. Data center and reports. https://www.in.gov/doe/it/data-center-and-reports/.