Projections show significant growth for Indiana's elderly population

By 2040, one out of every five Hoosiers will be a senior (age 65 or older) and most of the state's growth in that age cohort will occur in metropolitan counties.
With the oldest members of the baby-boom generation reaching 65 years of age in 2011, Indiana has already seen a 40% increase in the size of its senior citizen population between 2010 and 2023. The youngest of this cohort will hit traditional retirement age in 2029, at which point the ranks of Hoosier seniors will have grown by more than 500,000 residents over the previous two decades, according to population projections released by the Indiana Business Research Center.
Growth in the size of this age group will slow significantly between 2030 and 2050, before rebounding some during the 2050s as members of the millennial generation head into their golden years (see Figure 1)
Figure 1: Change in size of Indiana’s population age 65 and older by decade
Notes: Blue columns are actual data while red columns are projections.
Sources: U.S. Census Bureau and Indiana Business Research Center
As the number of seniors continues to grow, this group will claim an ever-larger share of Indiana’s total population (see Figure 2). By 2040, in fact, one out of every five Hoosiers will be a senior.
Figure 2: Share of Indiana’s population age 65 or older
Notes: Blue columns are actual data while red columns are projections.
Sources: U.S. Census Bureau and Indiana Business Research Center
Over the coming decades, the rate of growth for Indiana’s elderly population—or residents age 80 or older—will be even more dramatic. Between 2020 and 2040, we project that the state’s elderly population will grow by 185,000 residents—a 73% increase over this period. While growth in this age group will slow between 2040 and 2060, Indiana can still expect an 89% increase in the size of the elderly population between 2020 and 2060 (see Figure 3).
Figure 3: Indiana’s population age 80 and older
Notes: Blue columns are actual data while red columns are projections.
Sources: U.S. Census Bureau and Indiana Business Research Center
Around Indiana
Between 2020 and 2035, each of Indiana’s 92 counties can expect growth in the size of its population age 65 or older. From 2035 to 2050, however, only 21 counties will continue to see gains in this age group.
All told, suburban counties in the Indianapolis metropolitan area will show the strongest growth, with both Hamilton and Boone counties projected to see the size of their senior populations more than double between 2020 and 2050. At the other end of the spectrum, four counties in East-Central Indiana—Blackford, Grant, Randolph and Fayette—are expected to have the state’s largest declines in this age group, with each expected to see drops of more than 5% over the next three decades.
Looking at projected change by broad county type, the 44 Indiana counties that are part of a metropolitan statistical area will combine for a 38% increase in the size of its senior population between 2020 and 2050 (see Figure 4). Meanwhile, the state’s midsize communities—or micropolitan areas (meaning counties with a city or town that has a population between 10,000 and 50,000 residents)—will combine for an 18% increase in this age group through 2035. Beyond that point, however, this measure will begin to decline, and by 2050, the size of the senior population in this set of counties will only be 12% larger than it was in 2020. For rural Indiana, changes in this age group will follow a similar trajectory.1
Figure 4: Projected cumulative change for population age 65 and older by county type
Source: Indiana Business Research Center
Use the following interactive data visualization (Figure 5) to learn more about projected changes to senior and elderly populations in Indiana counties.
Interactive Figure 5: Projected change for population age 65 and older by county
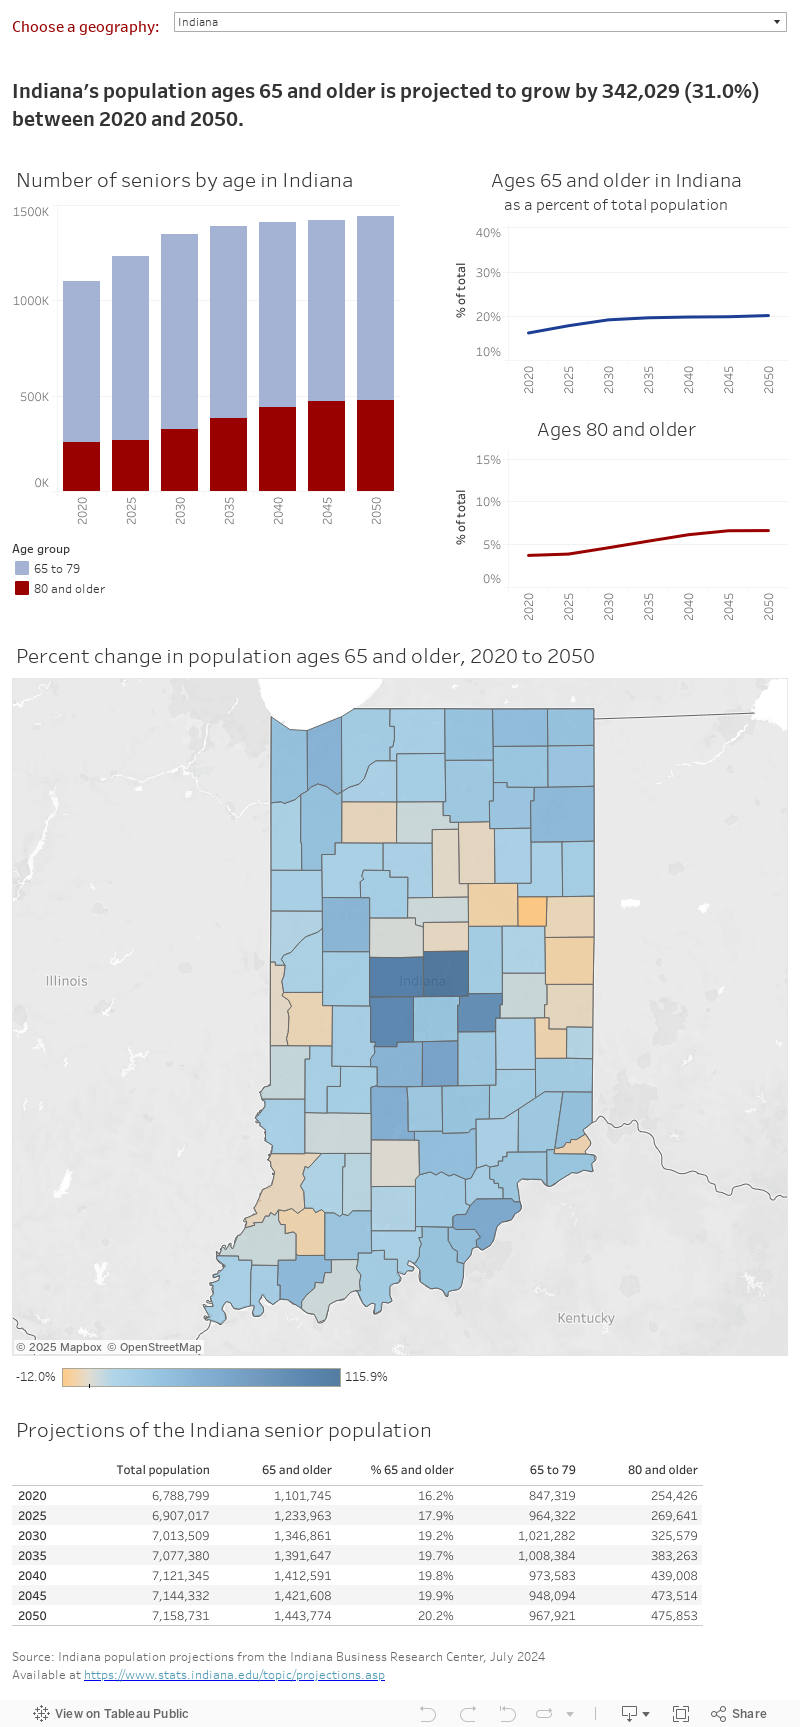
Source: Indiana Business Research Center
About the projections
The IBRC’s projections are purely demographic, meaning that they rely exclusively on recent birth/death data and migration estimates. Therefore, these figures reflect what Indiana and its communities will look like if past trends continue. No assumptions have been made about future economic conditions, land use decisions or environmental changes. However, State policy will assuredly have an effect, as will the decisions of individual residents and businesses.
Also, some population dynamics can be difficult to project. Migration, in particular, is prone to sudden swings. Therefore, long-range projections can be subject to significant error, and it is often useful to pay greater attention to trends during the first 15 to 20 years of the projections period.
To access the entire population projections data set or to read a detailed methodology, visit the STATS Indiana Population Projections topic page.
To view the Indiana Business Research Center’s labor force projections, visit Hoosiers by the Numbers.