Labor market balancing act

While still quite high, lowering levels of job openings, at a time when the numbers of unemployment relative to the labor force are historically low, show some decrease in pressure on businesses.
The tightening of the labor market in 2020 caused an increase in wages. This increase, along with many pandemic-induced economic side effects, such as supply chain issues, fuel costs and rising house prices, then caused inflation to rise dramatically. The Federal Reserve Bank began a series of interest rate hikes, with some criticism, which increased the cost of borrowing money (which then also inflates costs). Interest rate increases are one of the tools the Fed has to catalyze or temper the national economy. Is it working the way the Fed has intended? Inflation has stopped rising and the job market has definitely cooled, with the number of job openings shrinking relative to the number of people available for work.
Every day, businesses are posting jobs to fill (some are new jobs, some are vacancies) while people are hired or fired (or laid off or quit). To hone in on these dynamics of the labor market, we wanted to take a look at a federal survey available for states.
The latest data for Indiana for this new survey, the Job Openings and Labor Turnover Survey (JOLTS), from the U.S. Bureau of Labor Statistics (BLS) show us a striking set of changes between August 2022 and July 2023. Job openings ran upwards of 210,000 between November and December 2022. By February, there was a precipitous dip below 170,000 openings and the latest July data on openings are closer to 160,000. While still quite high, these lowering levels of job openings, at a time when the numbers of unemployment relative to the labor force are historically low, show some decrease in pressure on businesses.
Conversely, it also means fewer options for people looking for a job or wanting to switch jobs. Hiring was relatively stable, hovering between 140,000 and 150,000 at the end of 2022 and beginning of 2023, until a significant drop between the winter months of February and March. This was followed by a hiring spike that stopped by June. Since that drop in June, hiring in Indiana is slowly climbing back to that 140,000 mark of last fall.
Indiana job market dynamics: A 12-month trend using JOLTS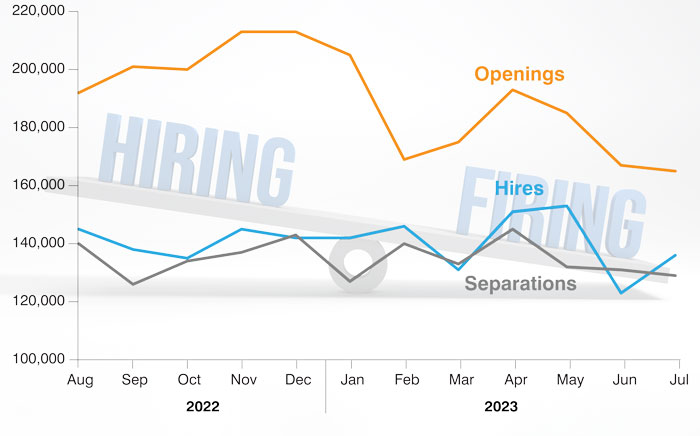
Source: U.S. Bureau of Labor Statistics, JOLTS data
Are you among the data curious? Here is some information on the source of these monthly, very helpful market dynamics data. JOLTS is a national survey by the U.S. Bureau of Labor Statistics which produces monthly data on national and state (sorry, no county or metro data) job openings, hires and separations. JOLTS samples tens of thousands of non-agricultural business establishments. The national JOLTS data set does provide helpful detail by industry that isn’t (yet?) available with the state-level data. Want to know more? BLS has a useful definitions page and the Indiana Department of Workforce Development has two very useful infographics: worker availability and insights on the state estimates.