COVID influences the labor force

Between 2019 and 2020, families with children under 18 where neither husband nor wife were in the labor force increased by 3%. However, the period between 2020 and 2021 saw an 8% decrease in households with neither husband nor wife in the labor force.
The COVID-19 pandemic gave many people in the labor force an opportunity to consider their work-life balance and subsequently make decisions about work that would impact their family’s lives. At the same time, a common refrain heard during the pandemic was that women left the labor force to take care of their kids. The subsequent shrinking labor force participation of women during the pandemic made “jump-starting” Indiana’s economy challenging, as jobs came back faster than the people returning to work.
This article looks at the characteristics of family household employment from 2019 (pre-pandemic) to 2021 (post pandemic). The data come from the U.S. Census Bureau’s 5-year estimates from the American Community Survey. It’s important to note that there is no age cap in the data for family households, so a married couple could be well into their golden years – some still working and others not.
To provide context, we will first look at the state’s numbers. Figure 1 shows the change in Indiana employment characteristics for married-couple families from 2019 to 2021. Indiana did not experience drastic changes in the labor force from 2019 to 2020, nor did it from 2020 to 2021. Of all family categories with both a husband and a wife, those with neither husband nor wife in the labor force experienced the largest percent change, growing 2% from 2019 to 2020 and then not at all the following year. As of 2021, there were 226,766 families with neither husband nor wife in the labor force.
Table 1: Change in Indiana employment characteristics for married-couple families, pre- and post-pandemic
| Employment characteristics | Total families | Families with own children under 18 years | Total families | Families with own children under 18 years | ||||
|---|---|---|---|---|---|---|---|---|
| Numeric change, 2019-2020 | Percent change, 2019-2020 | Numeric change, 2019-2020 | Percent change, 2019-2020 | Numeric change, 2020-2021 | Percent change, 2020-2021 | Numeric change, 2020-2021 | Percent change, 2020-2021 | |
| Families | 16,193 | 1.0% | 2,759 | 0.4% | 9,304 | 0.6% | 2,193 | 0.3% |
| Opposite-sex married-couple families | 3,804 | 0.3% | -881 | -0.2% | 5,653 | 0.5% | 2,571 | 0.5% |
| Both husband and wife in labor force | 9,294 | 1.4% | 1,483 | 0.5% | 4,084 | 0.6% | 3,223 | 1.0% |
| Husband in labor force, wife not in labor force | -1,953 | -0.8% | -908 | -0.7% | 1,051 | 0.4% | -142 | -0.1% |
| Wife in labor force, husband not in labor force | 1,270 | 1.4% | 336 | 2.0% | 655 | 0.7% | 38 | 0.2% |
| Both husband and wife not in labor force | 4,627 | 2.1% | 196 | 2.9% | -137 | -0.1% | -548 | -7.8% |
Note: The American Community Survey table from which this data is pulled (B23007) only presents data on opposite-sex married-couple families. Although other ACS tables collect data on same-sex married-couple households, those households are not represented in this particular data table. Source: U.S. Census Bureau, American Community Survey, 5-year estimates; table S2302
When children are added to the family household mix, it is a different story. Between 2019 and 2020, families with children under 18 where neither husband nor wife were in the labor force increased by 3%. However, the period between 2020 and 2021 saw an 8% decrease in these same households. It appears that either one or both parents has entered the labor force in recent years, dropping the number of families with children with both husband and wife not in the workforce from 6,803 in 2019 to 6,451 in 2021.
Between 2019 and 2021, Indiana increased its number of married couples by almost 9,500, resulting in more than 13,000 more families with both husband and wife in the labor force, 900 fewer families with only the husband in the labor force, 2,000 more families with only the wife in the labor force and roughly 4,500 more families with neither husband nor wife in the labor force.
Of the families with children under age 18, there was an increase of only 1,700 married couples, an increase of 4,700 families with both husband and wife in the labor force, a decrease of 1,000 families with only the husband in the labor force, an increase of 370 families with only the wife in the labor force and a decrease of 350 families with neither husband nor wife in the labor force.
Both husband and wife in labor force
Figure 2 shows the county-level percent change for families with both husband and wife in the labor force. Perhaps surprisingly, the percent change for families with both husband and wife in the labor force is highest in more rural counties, such as Fulton and Brown counties, which both experienced an increase of about 30% between 2019 and 2020. Tipton County, a rural county north of Indianapolis, experienced a sizeable increase of 17% for families with both husband and wife in the labor force. Many rural counties did not experience a decrease in the total number of families with both husband and wife in the labor force, pushing back on the idea that the pandemic forced families to drop down to one person in the house working.
Interactive Figure 2: Families with both husband and wife in labor force for Indiana counties
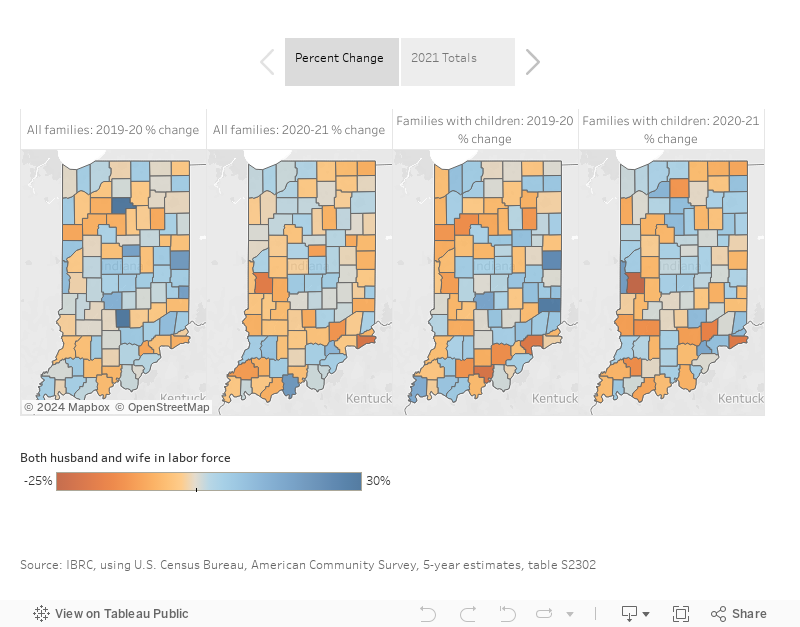
However, that changes when we look at families with children under 18. Many rural counties did experience a decrease in the number of families with children where both husband and wife were in the labor force from 2019-20, with Jefferson and Crawford counties decreasing the most in terms of percentage (-19% and -21%, respectively). Here, we can see the potential impact of one parent stepping out of the labor force to care for the kids in 2020. Forty-three of our 92 counties show a decrease in the number of parents in the family in the labor force.
Neither husband nor wife in the labor force
As for the state, the cohort with both husband and wife not working saw the largest change over this time for families with a child under 18. Families in this category increased by 2.9% from 2019 to 2020, but then decreased by 7.8% the following year. For total families with neither husband nor wife in the labor force, there was an increase of 2.1% from 2019 to 2020 and then a slight decrease of 0.1% from 2020 to 2021.
Wife only in labor force
The hypothesis that mothers left the labor force to care for their children during the pandemic is observed in the next two family types. The number of families with children with only the wife in the labor force grew by 2% from 2019 to 2020 and then slightly in the following year (0.2% from 2020 to 2021). Figure 3 shows the seven counties with more than a 50% decrease from 2019 to 2020 in families with children where only the wife was in the labor force: Brown, Clay, Posey, Rush, Vermillion, Wabash and Warren counties. Conversely, there are eight counties that show an increase of 50% or more.
Interactive Figure 3: Families with only wife in labor force for Indiana counties
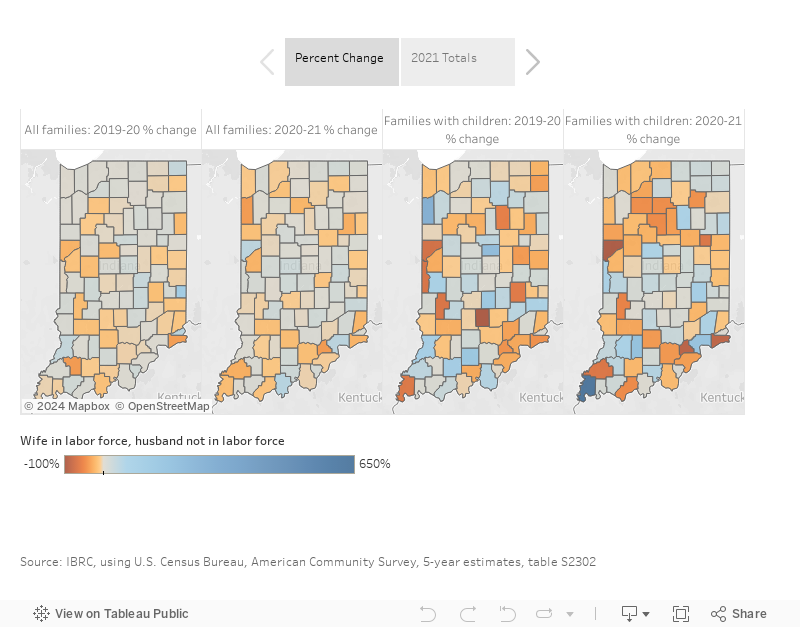
As for the state, there were 92,782 families where the wife was in the labor force and the husband was not in 2019. When it comes to families with a child under 18 in the household, the cohort experienced a 2% increase from 2019 to 2020. So, there were actually more families with only mothers/wives appearing in the labor force during the pandemic than the following year, which only saw 0.2% growth. If anything, this data indicates that at the state level, there were more families with children that had only a mother joining the labor force in 2020 (an increase of 336 families) than there were families with children that had only a father joining the labor force. That cohort experienced a decrease of 0.7% (or 908 families) between 2019 and 2020.
Husband only in labor force
In total, there are far more families with only a husband or father in the labor force than those with only a wife or mother in the labor force. In 2021, there were 259,044 total families with only a husband in the labor force and of them, 120,914 had a child under 18. Both categories saw a percentage drop from 2019 to 2020, indicating there are fewer men of the household in the labor force. It appears the hypothesis of more mothers at home with the kids while fathers work may not be true.
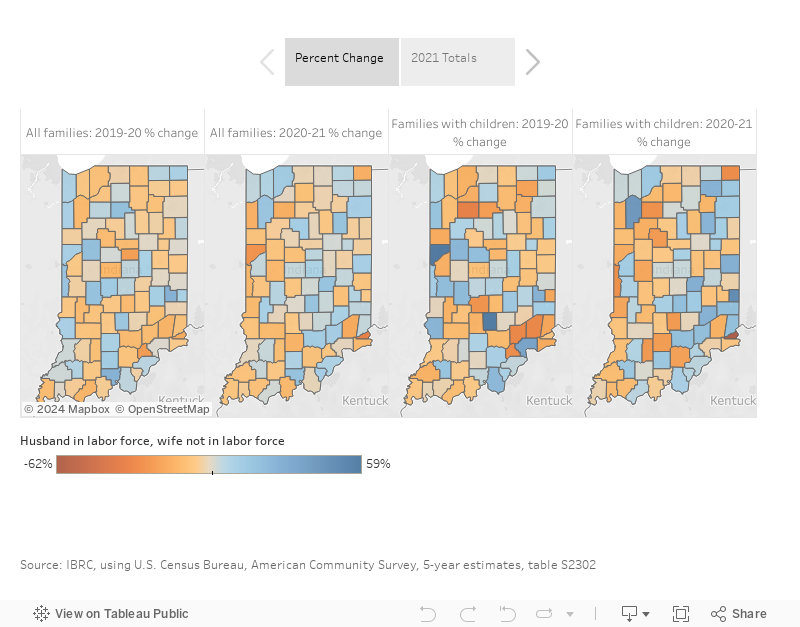
There are many counties that experienced a decrease in the number of families with children with only husbands in the labor force between 2019 and 2021, most of them being rural counties. Pulaski County experienced the largest percentage decrease between 2019 and 2020, with a decrease of 34%, while Ohio County saw a decrease of 62% between 2020 and 2021 (see Figure 4). Alternatively, Warren County saw the greatest percent change in the number of families with children with only husbands in the labor force between 2019 and 2020, experiencing growth of 59%. Union County led the pack in terms of percentage increase between 2020 and 2021, with an increase of 47%. The key here is the largest metropolitan areas saw an increase in this cohort, such as Indianapolis and Fort Wayne. Percentage increases in these more populous counties amount to more total change than decreases in less populous rural areas.
Interactive Figure 4: Families with only husband in labor force for Indiana counties
Urban vs. rural
Family household labor force participation between urban and rural areas varies considerably. For example, a change of work status within 100 families in a county as small as Union County has much greater impact than a change within 100 families in populous Allen County. Urban area trends also tend to align more closely to statewide trends.
Conclusion
The often-cited hypothesis that mothers in dual-parent households left the labor force to take care of their kids during the pandemic did happen, but not everywhere and not even necessarily during the pandemic, depending on where we look. At the county level, yes, there are counties that experienced a lot more fluctuation than the state and that is to be expected for a few reasons. Every county is unique in its industry and occupation makeup, its demographics, the resources available and opportunities for innovation. The innovation opportunities, specifically the “gig economy,” can be difficult to track. A person can easily work two or three jobs at a time, make as much money or more than a traditional job, yet end up paying less in taxes due to being paid in cash. As a result of these untraceable cash transactions, these workers won’t show up in wage records.
The gig economy can be applied to any of the cohorts mentioned in this article. Maybe the families with children and neither husband nor wife in the labor force that showed a 2.9% increase between 2019 and 2020 were actually working, but their work cannot be seen with the current system. For traditional employment at the state level, no, there does not appear to be fewer women in the labor force than before COVID, and for those that left, we do not know if they left to take care of their kids or work in the gig economy.