Do you know your labor analyst? If not, you should!

Demand is intensifying for professionals able to make sense of various data sets and weave them together to tell a cohesive story. In fact, the Bureau of Labor Statistics (BLS) projects that employment of data scientists will grow by an astounding 35% nationally between 2022 and 2032.
What is a labor analyst?
In essence, Indiana’s regional labor analysts keep our ears to the ground to stay informed on the economy in our local areas. We work independently and as a team on a wide variety of tasks which identify, analyze and project trends in Indiana’s economy and labor market. We develop new tools for analysis and an in-depth understanding of existing tools and software to aid in the presentation of data.
Our key role is to be a resource and provide labor market information (LMI) products and services to various groups and stakeholders. In other words, we are the front-line services of research and analysis. But the market for our services has changed over the years. In some states, labor analyst positions no longer exist. Fortunately, Indiana finds these positions to be of great value.
Why is this position and the data important?
Through the analysis and sharing of data, regional labor analysts play a pivotal role in influencing policy decisions. Our work with the data leads to important insights that can have significant impacts on the community. As labor analysts, we are trained to use a variety of tools and technologies in our quest for data. These tools allow us to identify trends and this insight often leads to recommendations for the development and improvement of various programs. Labor analysts provide stakeholders with data to make informed decisions for a variety of purposes, including business investments, career planning and preparation, education and training offerings, job searches, hiring and workforce investments. Labor market data is critical to understand the changing world of employment, wages, skills and productivity in an economy.
On a national level, the need for labor analysts is only increasing, as more organizations recognize the importance of data-driven decision-making. Demand is intensifying for professionals able to make sense of various data sets and weave them together to tell a cohesive story. In fact, the Bureau of Labor Statistics (BLS) projects that employment of data scientists will grow by an astounding 35% nationally between 2022 and 2032.1 Labor analysts assist with navigating the maze of data sources. Smaller organizations, in particular, benefit from the help of a labor analyst because their budgets do not allow for the hiring of a dedicated person to assist with this data.
WHO uses the data and HOW is it used?
The BLS probably says it best:
Labor market information is essential for tracking and analyzing the economy of a country. National and local governments need labor market information to reduce unemployment, generate employment and plan training programs to meet the needs of industry. It is also used in determining future workforce training needs, identifying the availability of labor, ascertaining prevailing wage rates and exploring potential markets. Labor market information is valuable to local and regional planning agencies, as well as industries and businesses looking for site locations, seeking ways of attracting and retaining skilled workers or assessing the scope and size of potential markets. Labor unions find this information useful for determining comparable wage and compensation levels, local working conditions and training needs. Investors, educators, workers and job seekers also benefit from timely and reliable labor market information to help them make sound decisions.2
The following stakeholders frequently call on us for local, customized data:
Company managers/owners – To understand the area labor market, determine the competitive atmosphere of their locations and plan for the future.
Counselors/placement specialists – To assist with job placement and direct individuals to training.
Economic developers/chambers of commerce – To promote economic growth and attract business establishments.
Education providers/institutions – To align education programs with occupations that are growing and in demand.
Government planners/consultants/legislators – To write reports, formulate/support policy decisions and develop economic proposals.
Grant writers – To support requests for project funding. It is crucial for grant writers to back up their proposals for grants. There is limited funding available and lots of competition for said funds. In addition, grant recipients must also meet performance metrics from the federal and state government.
Human resource managers – To determine labor availability, perform wage comparisons, develop wage inflators and structure wage scales. They also use this data in the development of affirmative action policies and in fulfilling government reporting requirements.
Market analysts – To research company or branch site locations, judge the strength of the local economy and make forecasts.
Media/public relations staff – To directly reflect local economic conditions in publications and research articles and stories.
Students/educators – To explore careers and occupations, write research papers, develop course work supplements and write professional journal articles.
Workforce development boards – To write regional plans and structure training and employment programs.
What is data collection and analysis? What sources are used?
Believe it or not, the work of a labor analyst requires a lot more than a smart phone, computer and Google. According to Fernando Sousa, "Data collection is the process of collecting and evaluating information or data from multiple sources to find answers to research problems, answer questions, evaluate outcomes and forecast trends and probabilities. It is an essential phase in all types of research, analysis and decision-making."3 Collecting and analyzing labor market data is essential when one is trying to answer questions about the economy. It’s all about asking the right questions to get the data needed to make informed decisions.
LinkedIn had the following to say about data sources:
When analyzing labor market data, the first step is to find reliable and relevant data sources. Depending on the research question, we may need data on labor force participation, unemployment, job openings, vacancies, hiring, wages, education, skills, occupations, industries, regions or demographics. The U.S. Bureau of Labor Statistics (BLS) and the U.S. Census Bureau are very widely used sources. The BLS provides official statistics on various labor market indicators, such as the Current Population Survey (CPS), Current Employment Statistics (CES), Job Openings and Labor Turnover Survey (JOLTS) and Occupational Employment and Wage Statistics (OEWS). The Census Bureau collects data on population, income, education and labor force characteristics through surveys and censuses, such as the American Community Survey (ACS), decennial census and the Survey of Income and Program Participation (SIPP).4
The following items are LMI data that is frequently used for customized requests:
- Affirmative action information
- Census data
- Commuting patterns
- Consumer Price Index
- County Highlights
- Employment/unemployment trends
- Industry employment data
- Labor activity - WARN notices
- Labor force estimates
- Local area demographic information
- Locally produced LMI information
- Occupational projections
- Per capita income
- Population data
- Unemployment claims activity
- Wage information
Another aspect of the labor market analyst job is creating labor market reports. Those include the following:
Industry Sector Snapshot report - A quarterly count of employment and wages by industry from the Indiana Department of Workforce Development and BLS.
Labor Market Review - A monthly newsletter that contains a snapshot of various labor market information for each of the 12 Economic Growth Regions (EGRs) in Indiana (see Figure 1). Some of the data found in this report includes labor force statistics (such as employment and unemployment numbers), the Consumer Price Index, unemployment insurance claims, WARN notices, Indiana Career Connect data (such as applicants and job postings), industry employment and BLS commentary. This report serves as a “one-stop shop” for all local labor market information. We collect the data and present it in an unbiased and concise manner.
Occupational Employment and Wage Statistics report – An annual report that contains employment and detailed wage data for all the occupations in the EGRs, metropolitan statistical areas and the Balance of State. The data in this report includes employment for each occupation, as well as average, 10th, 25th, median, 75th and 90th percentile wages.
Real-Time Job Demand report – A quarterly report that serves as an online job postings summary of real-time data including skills, certifications and education/experience from many different online job boards.
- Unemployment Claimant Profile – A quarterly report that details various demographic profiles from claimants of unemployment insurance.
These reports for Indiana can be accessed via the Publication Lookup Tool on Hoosiers by the Numbers.
Interactive Figure 1: Indiana’s EGRs and regional workforce analysts
Click on a region on the map to find your regional workforce analyst and explore data.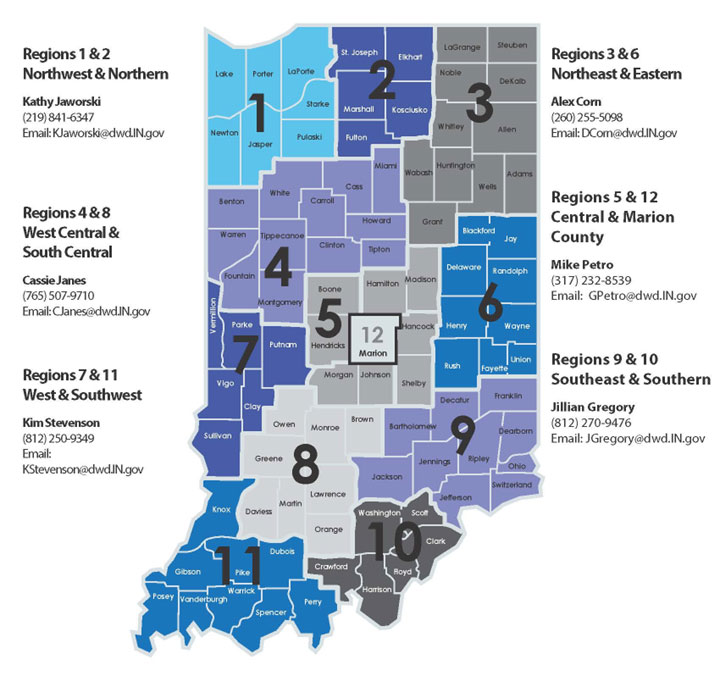
Source: Indiana Department of Workforce Development
In addition to the items listed previously, stakeholders have other topics of interest, including the following:
Occupations - Hot jobs in demand, growing occupations, declining occupations, new and emerging occupations.
Regional analysis including industry clusters and demographics (including age, citizenship and education levels of an area).
Wages to be competitive in pay.
Commuting patterns –This data is important for city planners and civil engineers to answer questions regarding road usage. How long is the average drive? How long are you willing to commute to work? What means of transportation are being used?
In short, Indiana’s regional labor analysts are called upon to assist anyone that needs data. Our services help to open the door of opportunity for upgrading quality of life in the state. Behind every number lies a story and we want to help tell it.
Notes
- U.S. Bureau of Labor Statistics, Employment Projections. Employment by detailed occupation. https://www.bls.gov/emp/tables/emp-by-detailed-occupation.htm
- U.S. Bureau of Labor Statistics, International Technical Cooperation. Labor Market Information: Business Establishment Surveys. https://www.bls.gov/itc/seminars-and-consultations/labor-market-information-business-establishment-surveys.htm
- Sousa, Fernando. “Enhancing financial inclusion in Africa: The crucial role of accurate data collection.” LinkedIn. https://www.linkedin.com/pulse/enhancing-financial-inclusion-africa-crucial-role-accurate-sousa/
- LinkedIn, “What are the best tools for analyzing labor market data?” https://www.linkedin.com/advice/0/what-best-tools-analyzing-labor-market-data-skills-economics