Population growth across Indiana's legislative districts

Find out how population growth affected Indiana’s legislative and congressional districts.
Indiana’s population grew 4.7% between 2010 and 2020, but those additional 301,726 residents were not evenly spread throughout the state’s legislative districts.1 Because districts must be of roughly equal population according to the law, the redistricting process occurs after every decennial census to re-balance legislative district populations.2
In Indiana, the redistricting process is handled by the Indiana General Assembly.3 When accused of gerrymandering (a topic that is outside the scope of this article), Republican leaders asserted that “all of the adjustments in their maps were based on population changes.”4
So how did population change in Indiana’s districts over the decade? The bulk of this article discusses the district-level population shifts since 2010 for the existing districts, highlighting which congressional and Indiana legislative districts had to grow or shrink geographically to meet the equal population criteria (keeping in mind that the equal population criteria is just one of several factors involved).5 The final section provides a brief look at the new districts, finalized by the Indiana General Assembly on October 1, and signed into law by the governor on October 4, 2021.
Congressional districts
Indiana has nine congressional districts and each one should contain 753,948 people as of the 2020 Census (this is up from the equilibrium point of 720,422 after Census 2010). As Figure 1 shows, five districts had too many people, while four had too few residents.
Figure 1: Congressional district population relative to the equilibrium point of 753,948 residents, 2020
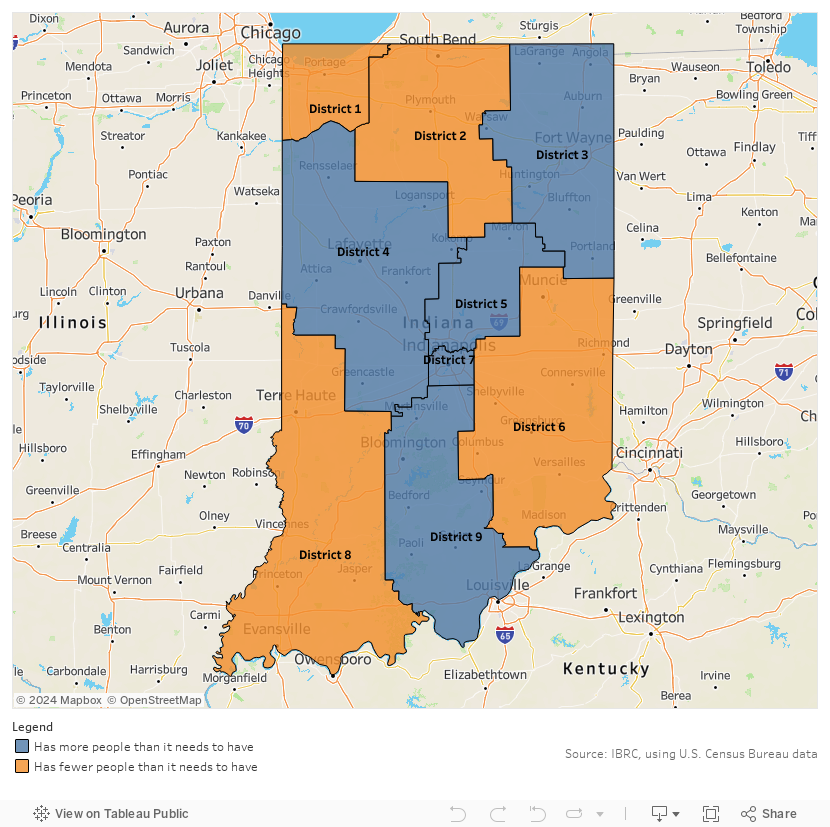
Congressional District 5 is Indiana’s most populous district, with 804,869 residents as of 2020. This is 89,500 people larger than the least populated district.
District 5 experienced the largest population change in both numeric (+84,446 residents) and percentage terms (+11.7%) over the decade. It exceeded the target equilibrium population by nearly 51,000 people (see Table 1).
Table 1: Highest to lowest gains: Existing congressional district population as of Census 2020
| Congressional district | 2020 total population | Change since 2010 | Percent change since 2010 | Number of residents that needed to change in order to meet new equilibrium target |
|---|---|---|---|---|
| District 5 | 804,869 | 84,446 | 11.7% | -50,921 |
| District 7 | 787,266 | 66,843 | 9.3% | -33,318 |
| District 9 | 766,617 | 46,195 | 6.4% | -12,669 |
| District 4 | 764,870 | 44,448 | 6.2% | -10,922 |
| District 3 | 758,914 | 38,491 | 5.3% | -4,966 |
| District 1 | 732,202 | 11,780 | 1.6% | 21,746 |
| District 2 | 731,881 | 11,458 | 1.6% | 22,067 |
| District 6 | 723,540 | 3,118 | 0.4% | 30,408 |
| District 8 | 715,369 | -5,053 | -0.7% | 38,579 |
Note: Red cells indicate populations below the 2020 equilibrium point of 753,948 residents.
Source: IBRC, using U.S. Census Bureau data
While Congressional District 8 was the only district to actually decline over the decade (it lost just over 5,000 residents, or -0.7%), the slow growth in District 6 (+0.4%) meant that it also needed to add more than 30,000 people to reach the new equilibrium point.
Indiana senate districts
The Indiana General Assembly has 50 senate districts and each one should contain 135,711 people as of the 2020 Census (this is up from the equilibrium point of 129,676 after Census 2010). As Figure 2 shows, 17 of the current districts had too many people, while 23 had too few residents (the remaining 10 districts fell within 1.5% of the equilibrium population—that was the acceptable level of population variance after the 2010 census).
Figure 2: Senate district population relative to the equilibrium point of 135,711 residents, 2020
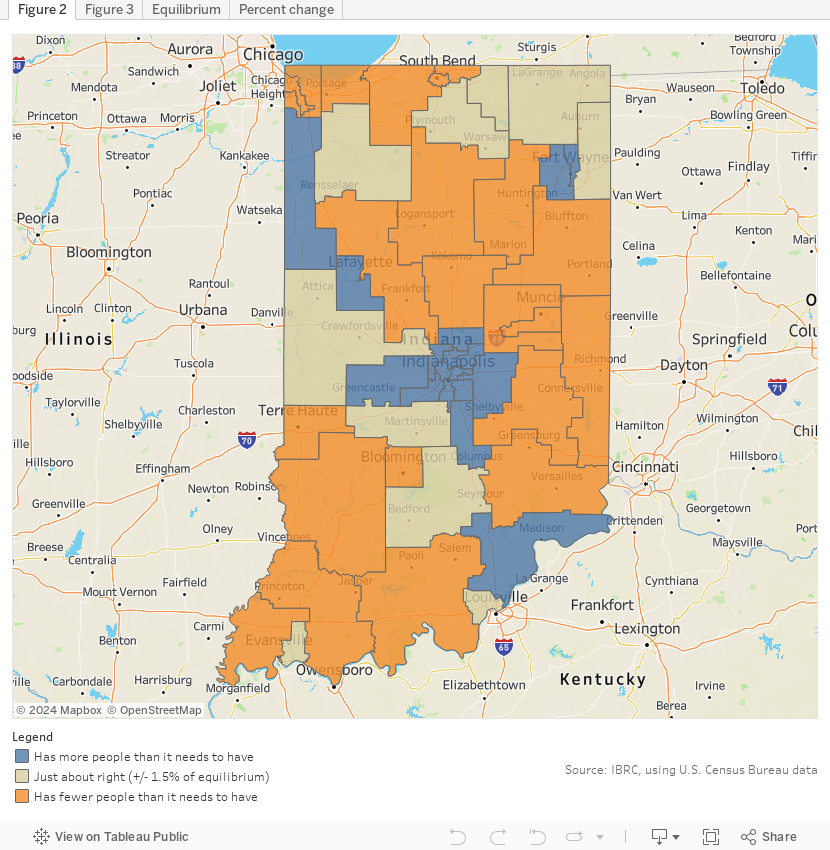
Senate District 20 (which includes parts of Carmel, Fishers, Noblesville and Westfield) grew the most, increasing by 29.3% (+38,036 residents). It exceeded the target equilibrium population by nearly 32,000 people. In all, 10 districts had growth of 10% or higher.
Meanwhile, 16 senate districts had population declines between 2010 and 2020. Two districts in Northwest Indiana experienced the largest losses (both numerically and in percentage terms).
- Senate District 3, which includes Gary, Hobart and Lake Station, declined by 8,462 residents (-6.5%).
- Senate District 2, which includes East Chicago, Hammond and Merrillville, declined by 7,945 residents (-6.2%).
In order to reach the target equilibrium population, both of these districts needed to add more than 13,000 people.
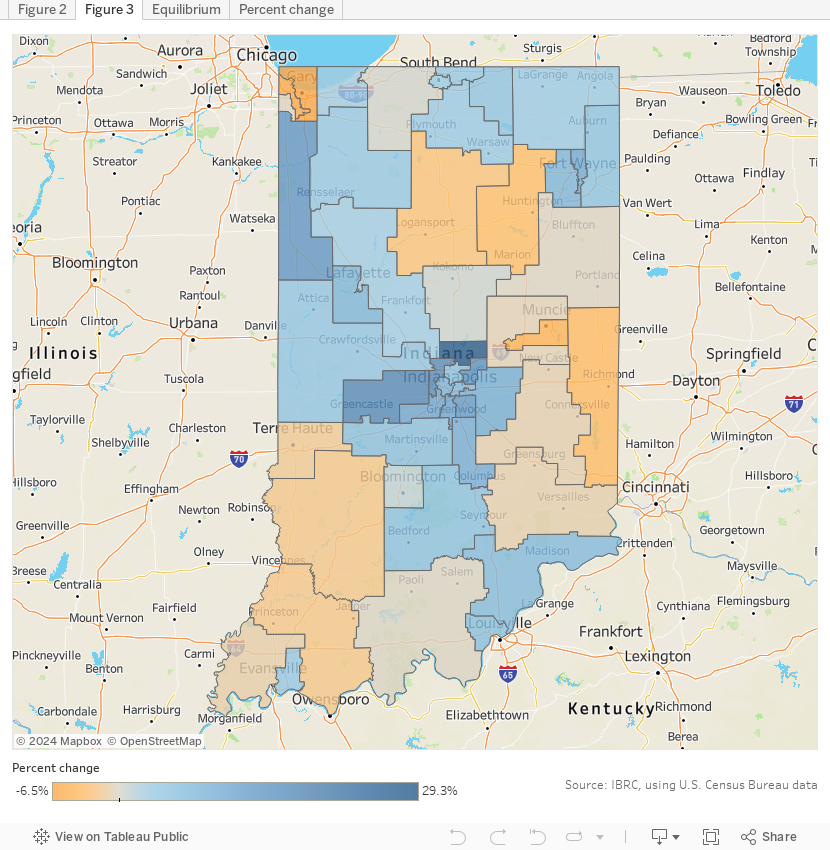
Figure 3 provides an interactive look at all of the senate districts and their population changes.
Figure 3: Indiana senate district population change, 2010 to 2020
Indiana house districts
The Indiana General Assembly has 100 house districts and each one should contain 67,855 people as of the 2020 Census (this is up from the equilibrium point of 64,838 after Census 2010). As Figure 4 shows, 37 of the current districts had too many people, while 51 had too few residents (the remaining 12 districts fell within 0.9% of the equilibrium population—that was the acceptable level of population variance after the 2010 census).
Figure 4: House district population relative to the equilibrium point of 67,855 residents, 2020
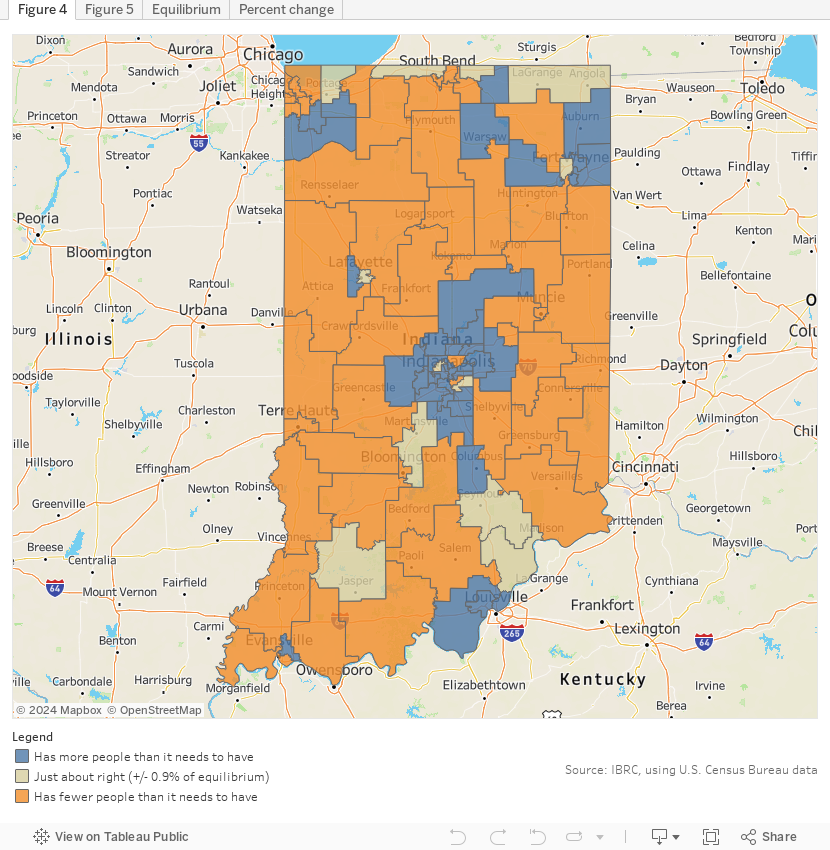
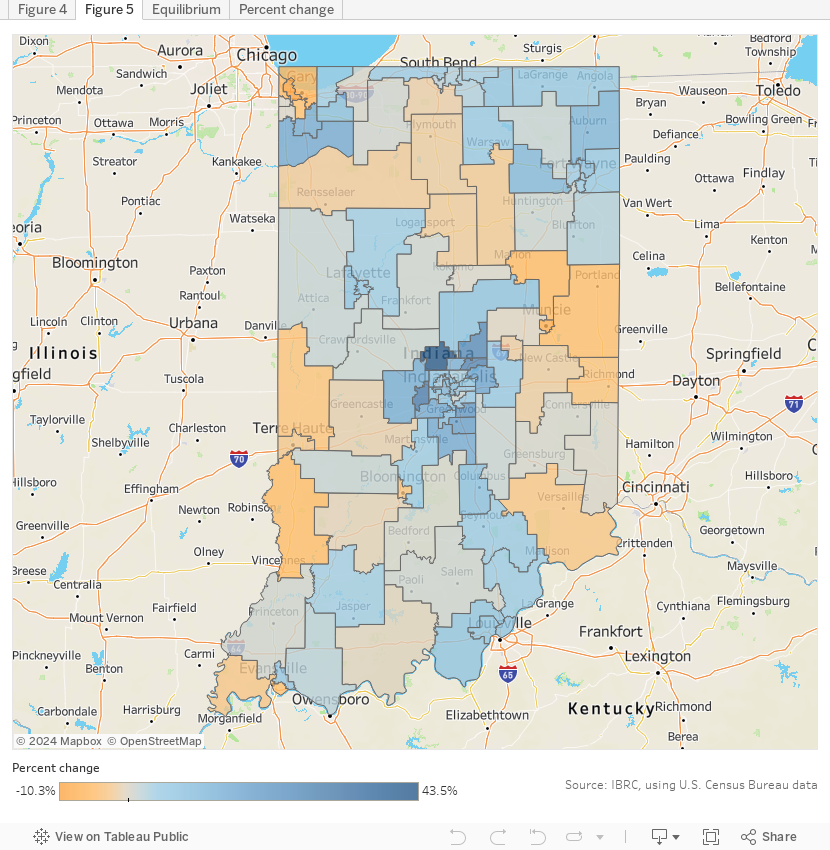
House District 24 (which includes Zionsville) grew the most at 43.5% (+28,448 residents). It exceeded the target equilibrium population by almost 26,000 people.
Twenty-seven house districts experienced population decline between 2010 and 2020. House District 2 (including East Chicago) experienced the largest decline (-6,679 residents, or -10.3%). In order to reach the target equilibrium population, this district needed to add nearly 9,800 people.
Figure 5 provides an interactive look at all of the house districts and their population changes.
Figure 5: Indiana house district population change, 2010 to 2020
The new 2021 districts
As a result of delays related to COVID-19 in 2020, the U.S. Census Bureau didn’t release the data needed for redistricting until August 12, 2021. The Indiana General Assembly chose to compress its time frame, with the entire process from its first proposed map to finalization taking less than a month. On October 4, 2021, Governor Holcomb signed the state’s new legislative and congressional districts into law.6
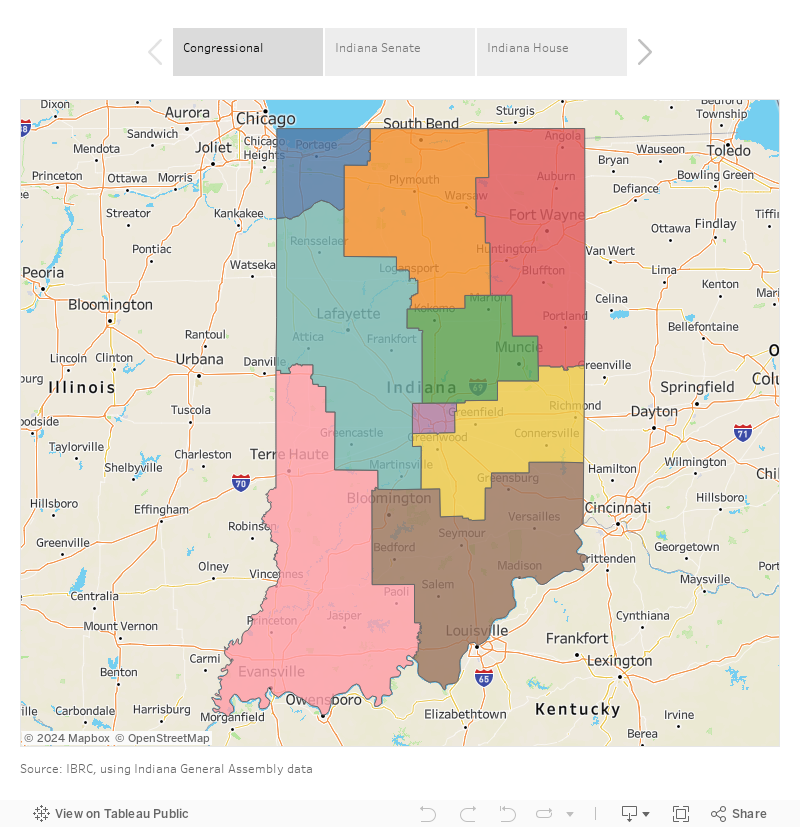
Figure 6 shows the finalized maps, which will be in effect for the November 2022 election. This is what the congressional and state legislative districts will look like until after the next decennial census in 2030.
Figure 6: Indiana’s new districts, adopted October 2021
Visit STATS Indiana’s redistricting topic page for additional information on both the existing districts and the new ones. Stay tuned for more data and analysis of the new districts in the coming months.
Notes
- For a broader discussion of Indiana’s population change and its uneven growth, see Matt Kinghorn, “Census 2020 shows metro areas have fueled Indiana's growth,” InContext, September-October 2021, www.incontext.indiana.edu/2021/sept-oct/article1.asp
- It wasn’t until 1964 that the Supreme Court codified the “one person, one vote” principle, which requires that districts be of equal population. The Wesberry v. Sanders decision that year applied equal population requirements to congressional districts, while the Reynolds v. Sims case applied it to state legislatures.
- For a listing and map of the 33 states where state legislatures play the dominant role in redistricting, see “State-by-state redistricting procedures,” Ballotpedia, https://ballotpedia.org/State-by-state_redistricting_procedures
- Kaitlin Lange, “Indiana House OKs maps that likely keep GOP supermajority. Here's what Democrats proposed,” Indianapolis Star, September 23, 2021, www.indystar.com/story/news/politics/2021/09/23/indiana-house-oks-redistricting-maps-favor-gop-supermajority/8418641002/
- In addition to the federal equal population requirement, Indiana’s only additional legal requirement is for contiguous regions in the state legislative districts (Ind. Const. art. IV, § 5). Best practices recommended by the Brennan Center for Justice include having contiguous regions; not diluting the votes of racial and language minorities; respecting the integrity of communities of interest; respecting the geographic integrity of political subdivision boundaries; and not unduly favoring or disfavoring any political party when considered on a statewide basis. See Yurij Rudensky and Annie Lo, “Creating strong rules for drawing maps,” Brennan Center for Justice, January 29, 2020, www.brennancenter.org/our-work/policy-solutions/creating-strong-rules-drawing-maps
- Tom Davies, “Indiana governor signs GOP’s contentious redistricting plan,” Associated Press, October 4, 2021, https://apnews.com/article/congress-indiana-redistricting-state-legislature-elections-2b0259c13bb97b3884d537c10936e434