How has Indiana census tract geography changed for the 2020 Census?
The fast-growing areas around Indianapolis have many tracts that were split into new tracts for the 2020 census.
Census tracts are incredibly useful for two reasons: size and comparability.
First, tract geographies are relatively small, so data users can see trends within specific areas (which is particularly important in densely populated areas). Second, their boundaries don’t change much over time, so users can conduct time series analysis.
However, saying they don’t change much isn’t the same as saying they don’t change at all. Realignments do happen. In particular, they are designed to have certain population limits, so growing areas will see tracts split and areas with population declines may see tracts merge. When a census tract is split, the new parts usually retain the original number but receive different suffixes (e.g., 3810.03 and 3810.04).
After each decade’s (decennial) census, the U.S. Census Bureau releases files that compare the geographic relationships over time to inform users of the geographies that had substantial changes (available on the Relationship Files page). At the time of this writing, only the block relationship files for 2020 are available. The bureau does not have a specific release date for the remaining 2020 geographic comparison files, but said they anticipate it would be closer to when the redistricting data are available in September (according to an email from their Public Information Office).
To give users an earlier glance at what has changed, this article provides a quick preliminary glimpse based on a comparison of Indiana’s 2010 and 2020 tract files from the 2020 redistricting data (P.L. 94-171) geographic support products release.
What are census tracts?
Census tracts are small, relatively permanent subdivisions of a county. They generally follow visible and identifiable land-based features (such as roads), but they can sometimes follow nonvisible legal boundaries (such as township lines). Tracts have between 1,500 and 8,000 people, with an optimum size of 4,000 people.1
Tracts are defined by the bureau in partnership with local groups via the Participant Statistical Areas Program. The concept actually originated in the early 1900s as a way to study change in neighborhoods within New York City, and eight cities ended up with census tracts for the 1910 census.2 Indianapolis first defined tracts for the 1930 census.3 The Census Bureau began publishing tract data as a standard tabulation with the 1940 census (which meant local tract committees no longer needed to purchase the special tabulations). It wasn’t until the 1990 census that the bureau opened up the census tract program to counties outside of metropolitan areas, and in that census all U.S. counties contained either census tracts or alternate “block numbering areas.”4 By 2000, census tracts were defined in all U.S. counties. Figure 1 shows how census tract geographic coverage spread across Indiana through the decades.
Figure 1: First year census tracts were defined across Indiana
Source: Indiana Business Research Center, using IPUMS NHGIS, University of Minnesota, www.nhgis.org
How are Indiana’s 2020 tracts different?
As of the 2020 census, Indiana has 1,696 census tracts5—which is 185 more than in the prior census.
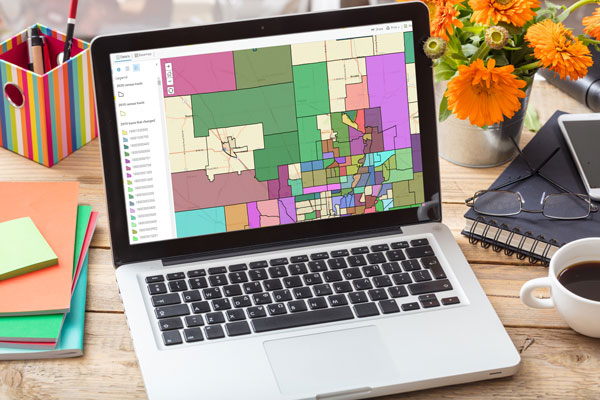
Figure 2 is an interactive map showing black outlines for the 2020 census tracts. The 2010 census tracts that are not geographically identical to the 2020 version are color-coded.
While 833 tracts (55%) are technically not identical to the prior census, it is important to note that many of these differences are quite minor. Splits are the most common substantial change, and we see a lot of that around the Indianapolis metro in particular. We encourage you to explore the map by zooming in and toggling the layers on and off (access the legend by clicking on the arrows in the upper left).
Figure 2: Indiana’s 2020 tracts
Source: Indiana Business Research Center, using the 2020 redistricting data files from the U.S. Census Bureau
What is the impact on opportunity zones?
At this juncture, it is worth mentioning that census tracts are designed for statistical purposes—but that doesn’t mean they aren’t also used for other purposes.
In particular, census tracts are the basis of the Opportunity Zone (OZ) program, which was created as part of the 2017 Tax Cuts and Jobs Act. In short, if a census tract has been classified as a qualified opportunity zone (QOZ), then private investment in that region may be eligible for capital gain tax incentives. Under the law, the existing opportunity zone tract designations remain in effect until Dec. 31, 2028.
This is where it gets tricky, since many of those census tract boundaries have now changed (a few apparently due to lobbying in hopes to capture some of the OZ tax incentives).6 According to analysis by Novogradac, 21% of the opportunity zone tracts nationwide increased in size, 15% split into multiple tracts and 20% decreased in size—which leads to lots of questions.
“OZ stakeholders are confused about the effect of these changes on future investments—prompting many questions like, ‘If the original geographic area of a QOZ census tract expanded as a result of the 2020 Census, does the new area qualify for OZ investment?’ or ‘If the original geographic area of a QOZ census tract contracted, do the original boundaries that are now outside the zone still qualify for OZ investment?’ or ‘If a QOZ is renumbered due to a split, do the original boundaries still qualify for investment?’ Unanswered questions like these are likely to lead to varying responses by different taxpayers.”7
At the time of this writing, the IRS and Treasury still haven’t answered these questions, but this will be an important decision to watch for.
Figure 3 shows that 88 of the tracts comprising Indiana’s opportunity zones had boundary changes (shown in blue), while 68 remain geographically identical to the original designation (shown in orange). Even though that sounds like a lot, in many instances, the changes appear to be minor, or even irrelevant in the cases of contiguous zones.
Figure 3: Indiana tracts designated as opportunity zones
Source: Indiana Business Research Center, using the 2020 redistricting data files from the U.S. Census Bureau and the opportunity zone designations from the U.S. Department of the Treasury.
Where can I find more tract information?
The Census Tract Map page on STATS Indiana compiles the tract boundary maps created by the Indiana Business Research Center through the years. There are county-level tract overview maps from 1990 to 2020, as well as interactive maps for both 2010 and 2020.
Census tract data for the 2020 tracts won’t be available until the redistricting data (aka the P.L. 94-171 data) are released in September.8 In the interim, users can access existing tract data from the American Community Survey at https://data.census.gov.
Users specifically interested in tracts designated as opportunity zones can check out the USA Opportunity Zones profiles via StatsAmerica. And of course, feel free to send an email to ibrc@iu.edu.
Notes
- “Glossary,” U.S. Census Bureau, www.census.gov/programs-surveys/geography/about/glossary.html#par_textimage_13
- “Census tract program for the 2010 decennial census—final criteria,” Federal Register 73, no. 51, March 14, 2008, www2.census.gov/geo/pdfs/reference/fedreg/tract_criteria.pdf
- “History: Tracts and block numbering areas,” U.S. Census Bureau, www.census.gov/history/www/programs/geography/tracts_and_block_numbering_areas.html
- “1990 Census of Population and Housing history,” U.S. Census Bureau, 3-13, www.census.gov/history/pdf/1990proceduralhistory.pdf
- This count does include the three water-based tracts covering Lake Michigan in northern Indiana.
- Noah Buhayar and Lydia O’Neal, “A Trump tax break kicked off a race to redraw U.S. Census maps,” Bloomberg, February 25, 2021, www.bloomberg.com/news/features/2021-02-25/trump-s-opportunity-zone-tax-break-started-a-race-to-redraw-census-maps
- John Sciarretti, “New census tract data raises questions for OZ stakeholders,” Novogradac, March 2, 2021, www.novoco.com/notes-from-novogradac/new-census-tract-data-raises-questions-oz-stakeholders
- James Whitehorne, “Timeline for releasing redistricting data,” U.S. Census Bureau Random Samplings blog, February 12, 2021, www.census.gov/newsroom/blogs/random-samplings/2021/02/timeline-redistricting-data.html