Annual Commuting Trends
Indiana tax returns provide us with a valuable source of commuting information through a partnership between state government and the Indiana Business Research Center (IBRC). The annual commuting profiles and maps on STATS Indiana are used frequently by the economic development community as they work to attract new businesses.
So how do we get this from a tax form? The Indiana individual tax form asks a question about the county where you lived and the county where you worked (see Figure 1). The Indiana Department of Revenue (IDOR) has to ask this for tax reasons, but the IBRC acquires these data in order to create the annual commuting profiles.1
Figure 1: What the Indiana IT-40 Tax Form Asks

Source: Indiana Department of Revenue
From the responses to that question, we are able to crunch the numbers to obtain the county-to-county work/residence patterns. For example, Table 1 shows that 7.7 percent of Marion County’s workforce lives in Hamilton County.
Table 1: Top 10 Counties Sending Workers into Marion County, 2012
| County | Number Commuting into Marion County | Percent of Marion County's Workforce |
|---|---|---|
| Hamilton County | 53,096 | 7.7 |
| Hendricks County | 32,854 | 4.8 |
| Johnson County | 27,231 | 3.9 |
| Hancock County | 15,397 | 2.2 |
| Morgan County | 11,085 | 1.6 |
| Boone County | 10,378 | 1.5 |
| Madison County | 6,057 | 0.9 |
| Shelby County | 4,252 | 0.6 |
| Out of State | 2,497 | 0.4 |
| Putnam County | 2,224 | 0.3 |
Source: STATS Indiana Commuting Profiles
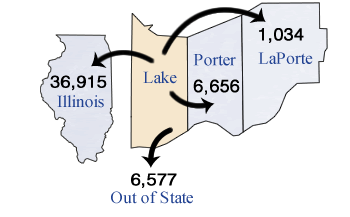
One downside to these data is the difficulty in tracking detailed out-of-state flows, which is especially problematic for Indiana’s border counties. For example, almost 37,000 Lake County residents commute into Illinois, but this data set does not give us any more detail as to where specifically they are working in the state (see Figure 2).
Figure 2: Top 5 Locations Receiving Workers from Lake County, 2012
Source: STATS Indiana Commuting Profiles
However, the upside is currency. At the time of this writing, data for 2012 are available on STATS Indiana, while the most recent year in other commuting-related data sources is 2011 in the Local Employment Dynamics data set2 and 2006-2010 averages in the American Community Survey.3
To access these annual profiles, which include high-resolution maps that you can download to include in your own reports and presentations, visit the Commuting Patterns Topic Page at www.stats.indiana.edu/topic/commuting.asp.
Notes
- The fact that these data are not collected for the sole purpose of tracking commuting does cause some oddities in the resulting data. For example, when filling out the IT-40, retired persons, homemakers and unemployed individuals are instructed to record the county where they live as the county where they work as well. This serves to artificially inflate both the implied resident labor force and the number of people who live and work in the same county.
- Use the OnTheMap tool to access commuting data from the Local Employment Dynamics data set at https://onthemap.ces.census.gov/
- Access Journey to Work data from the U.S. Census Bureau at www.census.gov/topics/employment/commuting.html.