Southwest Central Indiana: First Glimpses of an Emerging Region
A major new strategic planning effort was initiated in mid-2013 to identify paths to prosperity for an 11-county region in Southwest Central Indiana (SWCI). Following in the footsteps of efforts in other parts of Indiana that have yielded successful regional initiatives for progress,1 this project has engaged community stakeholders from all 11 counties, researchers from the Indiana Business Research Center (IBRC) and Battelle Technology Partnership Practice, facilitators from Energy Systems Network, and other key partners in major institutions throughout the region.
The IBRC's role was to benchmark the SWCI region’s economic and demographic characteristics, analyzing its performance over time and comparing it to peer regions around the nation. Although regional planning is still underway and a report on the full project is not expected until later this year, this article provides a first public look at some findings of the benchmarking analysis, offering insights into a diverse region with both great potential and significant challenges.
The 11 counties comprising SWCI are Brown, Crawford, Daviess, Dubois, Greene, Lawrence, Martin, Monroe, Orange, Owen and Washington counties (though this set may evolve as the planning process develops). This group was selected by combining two formal regions that overlap significantly. The Indiana Department of Workforce Development’s Economic Growth Region (EGR) 8 includes eight of the SWCI counties, while the territory served by the economic development organization Radius Indiana also includes eight counties, of which three are not part of EGR 8 and vice versa.
Demographic Dynamics and Contrasts
SWCI is a study in contrasts, as evidenced in Table 1. More than a third of its nearly 400,000 residents live in Monroe County, which is more than 13 times as large as the smallest county. From 2000 through 2012, the region’s population grew nearly as quickly (averaging 0.56 percent per year) as the state as a whole (0.61 percent), but four counties experienced modest shrinkage over this period. Monroe’s growth (1.31 percent), however, outpaced both the state and the region by a wide margin.
Table 1: Population Characteristics, 2012
| County | Total Population | Average Annual Percent Change, 2000-2012 | Minorities as a Percent of Total Population | Median Age |
|---|---|---|---|---|
| Brown | 15,083 | 0.07% | 3.7% | 47.9 |
| Crawford | 10,665 | -0.06% | 3.3% | 42.5 |
| Daviess | 32,064 | 0.61% | 6.5% | 35.1 |
| Dubois | 42,071 | 0.49% | 7.9% | 40.4 |
| Greene | 32,940 | -0.05% | 2.8% | 42.1 |
| Lawrence | 46,078 | 0.03% | 3.6% | 42.1 |
| Martin | 10,260 | -0.09% | 2.4% | 42.1 |
| Monroe | 141,019 | 1.31% | 14.4% | 28.1 |
| Orange | 19,690 | 0.16% | 4.0% | 41.2 |
| Owen | 21,380 | -0.16% | 3.2% | 43.3 |
| Washington | 27,921 | 0.21% | 2.8% | 40.1 |
| SWCI Region | 399,171 | 0.56% | 6.4% | 36.4 |
| Indiana | 6,537,334 | 0.61% | 19.0% | 37.0 |
Source: U.S. Census Bureau Population Estimates (Vintage 2012)
SWCI overall is just one-third as diverse as Indiana with respect to minority population (6.4 percent vs. 19.0 percent, respectively), and in most SWCI counties white residents comprise more than 95 percent of the total. Monroe again stands out from the rest of the region at 14.4 percent minority residents. Not surprisingly, given its large college student population, Monroe County has the youngest median age at 28.1, followed by Daviess at 35.1 years. The remaining counties all have median ages above 40. Thus, the majority of SWCI’s nearly 4,500 square miles is occupied by a somewhat older population.
Population and labor force projections offer added perspective on trends in the region. During the 2010-2020 decade, SWCI’s population growth is projected to average 0.45 percent annually, falling to 0.32 percent in the 2020-2030 period. Figure 1 shows a substantial rise in the number of seniors (age 65+) and a corresponding decline in the numbers of older adults (45-64) as the bulk of the baby boom generation moves into traditional retirement age. Growth in the 65+ group will single-handedly drive total population gains in several SWCI counties while only moderating declines in many others.
Figure 1: Population Projections by Age, SWCI Region, 2010 to 2030
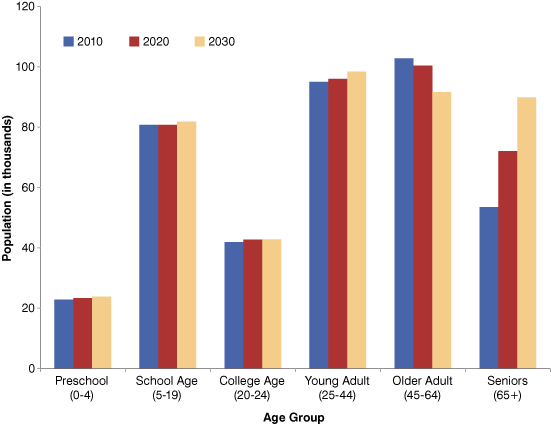
Source: Indiana Business Research Center
Table 2 presents projected changes in the size and growth rate of the region’s labor force (those working or seeking work) from 2000 through 2030.
Table 2: Labor Force Projections, 2000 to 2030
| County | Labor Force (thousands) | Average Annual Percent Change | ||||||
|---|---|---|---|---|---|---|---|---|
| 2000 | 2010 | 2020 | 2030 | 2000-2010 | 2010-2020 | 2020-2030 | ||
| Brown | 7.7 | 7.6 | 7.1 | 6.4 | -0.17% | -0.65% | -1.07% | |
| Crawford | 4.9 | 5.0 | 4.7 | 4.3 | 0.12% | -0.58% | -0.86% | |
| Daviess | 13.9 | 15.2 | 16.0 | 16.6 | 0.87% | 0.52% | 0.39% | |
| Dubois | 21.4 | 22.0 | 22.7 | 21.7 | 0.27% | 0.28% | -0.43% | |
| Greene | 16.1 | 15.7 | 15.2 | 14.2 | -0.27% | -0.34% | -0.65% | |
| Lawrence | 23.0 | 21.4 | 20.7 | 19.2 | -0.72% | -0.34% | -0.73% | |
| Martin | 5.1 | 5.0 | 4.7 | 4.4 | -0.22% | -0.62% | -0.68% | |
| Monroe | 64.8 | 69.4 | 74.8 | 78.7 | 0.69% | 0.76% | 0.51% | |
| Orange | 9.2 | 9.1 | 9.1 | 8.6 | -0.11% | -0.09% | -0.51% | |
| Owen | 10.9 | 10.5 | 9.9 | 9.0 | -0.36% | -0.55% | -0.97% | |
| Washington | 13.8 | 13.6 | 13.7 | 13.2 | -0.18% | 0.09% | -0.33% | |
| SWCI Region | 190.9 | 194.4 | 198.4 | 196.4 | 0.18% | 0.21% | -0.10% | |
| SWCI Region without Monroe County | 126.1 | 125.0 | 123.6 | 117.6 | -0.09% | -0.11% | -0.50% | |
| Indiana | 3,120.9 | 3,253.0 | 3,370.3 | 3,362.2 | 0.42% | 0.36% | -0.02% | |
Source: Indiana Business Research Center
The labor force in SWCI as a whole grew modestly during the last decade—though if one excludes Monroe County, the rest of SWCI’s labor force actually shrank slightly with losses in seven counties. Crawford, Daviess and Dubois join Monroe as counties with growing labor forces during this century’s first decade.
Between 2010 and 2020, the regional labor force is expected to continue its modest growth, with Monroe, Daviess, Dubois and Washington counties experiencing growth (see Figure 2).
Figure 2: Projected Average Annual Percent Change in SWCI Labor Force, 2010 to 2020
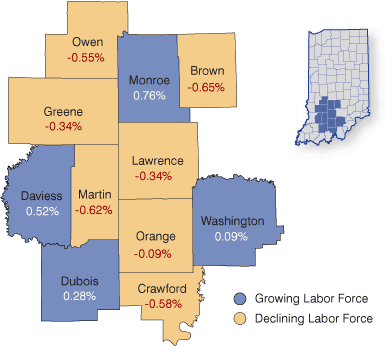
Source: Indiana Business Research Center
In the 2020-2030 decade, all of the counties except Monroe and Daviess are expected to have shrinking labor forces. Addressing the challenge of labor force downsizing will likely be crucial to the region’s economic vitality and the local services that depend on working people spending their paychecks and paying taxes.
Educational Attainment
Critically important to a region’s productivity are the skills and knowledge of its workforce. Although this study did not measure these indicators directly, educational attainment is closely correlated with overall workforce readiness, especially for the higher-income jobs that can propel economic growth. Figure 3 shows the percentage of each county’s adults (age 25 and older) for each level of educational attainment.
Figure 3: Educational Attainment of the SWCI Region in 2011 and Percentage Point Change since 2000
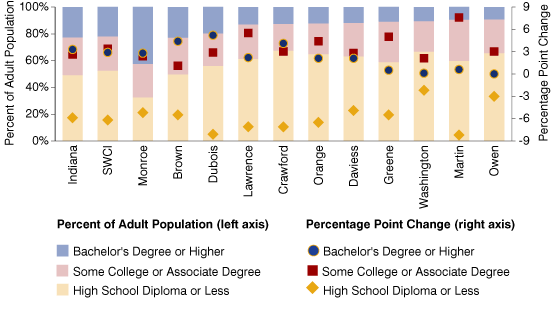
Note: The adult population includes those age 25 and older.
Source: U.S. Census Bureau, 2000 Census data and 2011 American Community Survey, 5-year estimates
The region as a whole has lower attainment than the state on both college-level attainment measures, and slightly over half of SWCI adults have completed no more than a high-school education. A quarter of the region’s adults have completed some college or an associate degree, with slightly fewer completing a bachelor’s or higher degree.
Attainment varies greatly throughout the region, however. Not surprisingly, Monroe County leads both the region and the state by a wide margin in post–high school education. Among the other counties, in only Brown have more than half of the adults gone beyond high school. The other counties have high-school-or-lower completion levels ranging from 56.2 percent (Dubois) to 67.4 percent (Crawford).
Figure 3 also shows the change in each attainment level from 2000 through 2011. It’s encouraging to observe reduction across the board in the share of adults with high-school-or-lower attainment; the region has knocked 6.2 percentage points off this share since 2000. More of the improvement in attainment occurred at the some-college-or-associate-degree level than for bachelor’s-and-higher attainment; however, the opposite was true in Monroe, Brown, Crawford and Dubois counties.
Laying the Foundation for Planning
These observations represent just the tip of the iceberg in insights coming from the SWCI initiative. Understanding the nature of this region and how it’s changing over time is crucial context for the emerging regional planning effort. Future InContext articles will explore additional findings from the study. As planning discussions among regional leaders and stakeholders progress, we hope this background provides useful perspective for setting goals and identifying potential paths to prosperity.
This study and related SWCI work were supported by generous funding from the Lilly Endowment, in collaboration with Energy Systems Network and the Central Indiana Corporate Partnership.