The drivers of Indiana's transportation and warehousing growth

The total number of transportation and warehousing jobs is 171,310 statewide, accounting for 6% of total employment in Indiana.
Transportation and warehousing has been the fastest-growing industry sector both nationally and in Indiana over the past decade. With an official state motto of “The Crossroads of America” since 1937,1 it is no surprise that this sector has long played an important role in Indiana. This article explores the industries within the transportation and warehousing sector to shed more light on how the individual components of the larger sector are faring.
This article explores annual averages from 2011 to 2021. The Indiana Business Research Center calculates annual averages from the Quarterly Census of Employment and Wages (QCEW) data set, which is produced by the U.S. Bureau of Labor Statistics (BLS), and publishes these on STATS Indiana.
The sector is growing fast
Indiana’s transportation and warehousing sector grew by 36.8% between 2011 and 2021, adding 46,116 jobs. This brings the total number of transportation and warehousing jobs to 171,310 statewide, accounting for 6% of total employment in Indiana.
For comparison, the sector gained nearly 1.9 million jobs nationally for a 37.6% growth. There are more than 6.9 million transportation and warehousing jobs in the U.S., accounting for 5% of total employment.
For more details on how this sector compares to others, see last month’s article, “Employment growth within Indiana’s industry sectors.”
Understanding the classifications
Before we jump into exploring the sector’s components, a short discussion about the North American Industry Classification System (NAICS) is in order. The NAICS system is the standard used by North America’s federal statistical agencies to categorize businesses. It uses a numbered hierarchy to classify businesses by sector (2-digit), subsector (3-digit), industry group (4-digit), NAICS industry (5-digit) and national industry (6-digit).
The transportation and warehousing sector is comprised of 11 subsectors, 29 industry groups, 42 NAICS industries and 57 national industries—though it is worth noting that not all of those are unique groupings (see Table 1).2
Table 1: NAICS hierarchy for the transportation and warehousing sector
| Subsector | Industry group |
|---|---|
| Air transportation | Scheduled air transportation |
| Nonscheduled air transportation | |
| Rail transportation | * |
| Water transportation | Deep sea, coastal, and Great Lakes water transportation |
| Inland water transportation | |
| Truck transportation | General freight trucking |
| Specialized freight trucking | |
| Transit and ground passenger transportation | Urban transit systems |
| Interurban and rural bus transportation | |
| Taxi and limousine service | |
| School and employee bus transportation | |
| Charter bus industry | |
| Other transit and ground passenger transportation | |
| Pipeline transportation | Pipeline transportation of crude oil |
| Pipeline transportation of natural gas | |
| Other pipeline transportation | |
| Scenic and sightseeing transportation | Scenic and sightseeing transportation, land |
| Scenic and sightseeing transportation, water | |
| Scenic and sightseeing transportation, other | |
| Support activities for transportation | Support activities for air transportation |
| Support activities for rail transportation | |
| Support activities for water transportation | |
| Support activities for road transportation | |
| Freight transportation arrangement | |
| Other support activities for transportation | |
| Postal service | * |
| Couriers and messengers | Couriers and express delivery services |
| Local messengers and local delivery | |
| Warehousing and storage | * |
![]() Download the complete NAICS hierarchy for this sector down to the 6-digit level »
Download the complete NAICS hierarchy for this sector down to the 6-digit level »
* Asterisks indicate the industry group has the same name/categorization as the subsector.
Source: IBRC, using U.S. Bureau of Labor Statistics QCEW data
It is important to note that NAICS definitions are updated every five years to reflect changes and innovations in the economy. Needless to say, this has the potential to complicate one’s analysis. For example, the decade we are exploring has data coded to three different NAICS versions.3
- 2011 uses the 2007 version
- 2012-2016 uses the 2012 version
- 2017 to 2021 uses the 2017 version
Luckily for us, there were no changes within the transportation and warehousing sector classifications in these vintages, so we may happily proceed with our time series comparison without any NAICS-related caveats.4
Subsector breakdown
Figure 1 shows how Indiana’s transportation and warehousing employment is divided among the subsectors, as well as how it compares to the national distribution. (Note: Data for both water and rail transportation are completely undisclosed at the state level. In addition, there is some partial data suppression within the warehousing and storage, support activities for transportation and pipeline transportation subsectors.5)
A third of Indiana’s sector employment is in warehousing and storage, compared to 25% nationwide. In addition, truck transportation accounts for 31% of Indiana’s total sector employment. Couriers and messengers comes in third with 14% of Indiana’s sector employment. As info, this subsector is defined as providing “intercity and/or local delivery of parcels and documents (including express delivery services) without operating under a universal service obligation.”6
Figure 1: Transportation and warehousing subsectors as a percent of sector employment
Note: Indiana employment for the water transportation and rail transportation subsectors are undisclosed, so they are omitted from the graphic. The corresponding percentages for the U.S. are 0.9% and 0.01% of sector employment, respectively.
Source: IBRC, using U.S. Bureau of Labor Statistics QCEW data
Employment over the decade
Out of Indiana’s nine subsectors with data available, warehousing and storage saw the most growth in numeric terms, gaining 35,779 workers since 2011 (+165%). This far surpassed the couriers and messengers subsector, which gained 9,693 workers over the decade (+65%). Truck transportation came in with a much smaller growth of 2,052 (+4%).
Figure 2 shows these percent changes for the nine subsectors relative to the nation. Indiana’s scenic and sightseeing transportation stands out with a 359% increase in employment. While still notable that employment in this subsector increased at a time when the U.S. saw a 13% decline (because nationally it has not yet recovered from pandemic-related declines), the large percent change should be taken with a grain of salt given the very small base used in the calculation. Indiana started the decade with just 81 workers in scenic and sightseeing transportation, so this huge increase in percentage terms amounts to only 291 new jobs over the decade.
Figure 2: Percent change in jobs, 2011-2021
Note: Chart is sorted by numeric change in Indiana employment. Indiana employment for the water transportation and rail transportation subsectors are undisclosed, so they are omitted from the graphic. The percent changes for the U.S. in those subsectors are -7.4% and -39.8%, respectively.
Source: IBRC, using U.S. Bureau of Labor Statistics QCEW data
Exploring the growth year by year provides some additional insight into several of the subsectors (see Figure 3). For example, virtually all of the decline in Indiana’s air transportation sector occurred between 2014 and 2015.
Interactive Figure 3: Employment by transportation and warehousing subsector over time
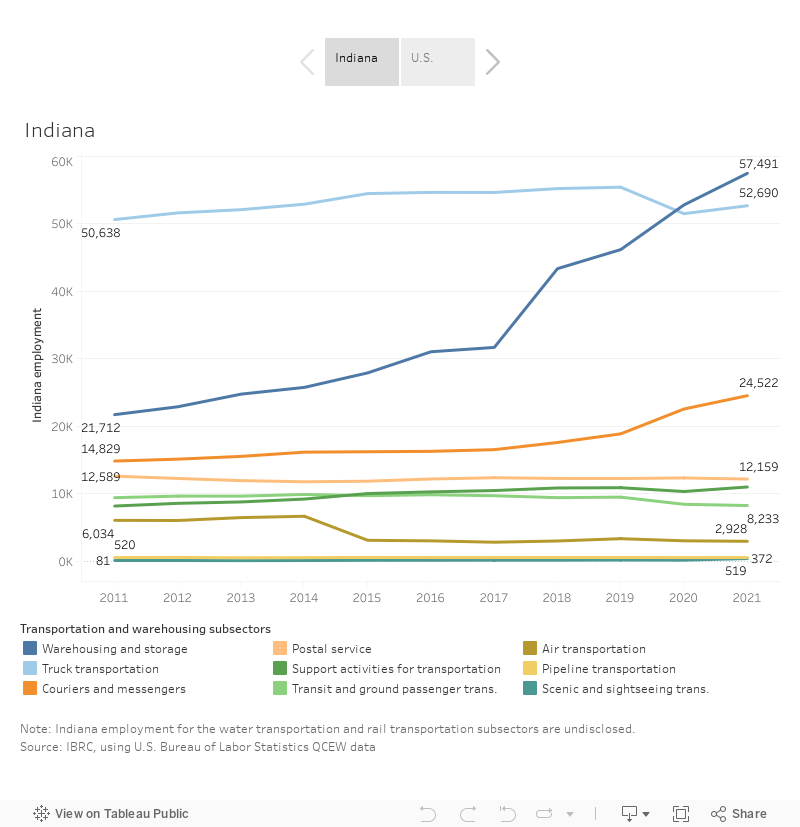
You also see the visible hit that Indiana’s truck transportation subsector took during the pandemic—which it has yet to recover from. Between 2019 and 2021, it lost 2,751 jobs, a decline of 5%. Nationwide, truck transportation took less of a hit in truck transportation and is only 1.5% off of its pre-pandemic level (it declined 4% in 2020 relative to Indiana’s 7% decline, so it had less ground to make up).
Truck transportation is not the only subsector still recovering from the pandemic. Table 2 shows that five of the nine subsectors for which we have available state data had not yet returned to their 2019 averages as of 2021. Since annual averages for 2022 won’t be available until June, we have supplemented this table with the second quarter 2022 data to hint at the continued recovery in all of these subsectors, except for the postal service. In fact, as of the second quarter of 2022, air transportation appears to have recovered from its pandemic losses, so that leaves only four of the subsectors still in recovery mode.
Table 2: Employment change in Indiana’s transportation and warehousing subsectors
| Subsector | 2019 to 2021 | 2019 to 2022 Q2 | ||
|---|---|---|---|---|
| Numeric change | Percent change | Numeric change | Percent change | |
| Transportation & warehousing total | 13,162 | 8.3% | 20,307 | 12.8% |
| Warehousing and storage | 11,303 | 24.5% | 15,434 | 33.4% |
| Couriers and messengers | 5,659 | 30.0% | 6,099 | 32.3% |
| Scenic and sightseeing transportation | 215 | 136.9% | 360 | 229.3% |
| Support activities for transportation | 109 | 1.0% | 819 | 7.5% |
| Pipeline transportation | -5 | -1.0% | -2 | -0.4% |
| Postal service | -80 | -0.7% | -492 | -4.0% |
| Air transportation | -388 | -11.7% | 208 | 6.3% |
| Transit and ground passenger transportation | -1,244 | -13.1% | -1,186 | -12.5% |
| Truck transportation | -2,751 | -5.0% | -1,231 | -2.2% |
Note: This table is sorted by the 2019 to 2021 numeric change. Indiana employment for the water transportation and rail transportation subsectors are undisclosed. All changes are based on the 2019 annual averages.
Source: IBRC, using U.S. Bureau of Labor Statistics QCEW data
Location quotients
Location quotients (LQs) are a useful tool to measure a region’s industrial specialization relative to a larger geography. In our case, we calculated each subsector’s share of total overall employment in Indiana relative to the nation. An LQ greater than 1 indicates that Indiana has proportionately more workers than the U.S. in that subsector and can be considered specialized. Overall, Indiana’s transportation and warehousing sector as a whole surpasses that threshold with an LQ of 1.18.
At the subsector level, three of Indiana’s transportation and warehousing subsectors can be considered specialized:
- Truck transportation: 1.67
- Warehousing and storage: 1.61
- Couriers and messengers: 1.08
We can utilize LQs further by exploring how specialization within the transportation and warehousing sector is changing over time. To do so, the subsectors can be divided into four categories:7
-
Stars: These clusters are relatively specialized (LQ > 1) and are becoming even more specialized over time within the region.
-
Emerging: These clusters are relatively unspecialized (LQ < 1) but are becoming more specialized over time within the region.
-
Mature: These clusters are relatively specialized (LQ > 1) but are becoming less specialized over time within the region.
-
Transforming: These clusters are relatively unspecialized (LQ < 1) and are becoming even less specialized over time within the region.
Indiana’s transportation and warehousing sector as a whole falls into the “star” category, with an LQ of 1.18 and a 1% increase in specialization over the decade.
Figure 4 shows the subsectors categorized according to this rubric. Warehousing and storage is Indiana’s star, with an LQ of 1.61 and increasing specialization. Scenic and sightseeing transportation shows through-the-roof growth in specialization, though, as mentioned previously, a lot of that can be explained away by the incredibly small employment base it was starting from.
Figure 4: Indiana’s transportation and warehousing subsectors by LQ classification
Note: Bubble size represents 2021 employment. Indiana employment for the water transportation and rail transportation subsectors are undisclosed.
Source: IBRC, using U.S. Bureau of Labor Statistics QCEW data
Summary
The transportation and warehousing sector’s high growth over the past decade in Indiana has been largely driven by the warehousing and storage subsector. Its employment grew by 165% to surpass truck transportation as the largest subsector within the broader sector. In addition, warehousing and storage classifies as Indiana’s only “star” within this sector for having both high and increasing specialization relative to the nation. However, given the current economic environment, it is unlikely for this subsector’s rapid growth to continue.
Some other subsectors to continue watching include truck transportation (to see if it can finish recovering from the pandemic-related declines); couriers and messengers (to see if it retains its pandemic-related growth); support activities for transportation (given its status as an emerging subsector); as well as scenic and sightseeing transportation (to see if its recent growth turns into a trend).
This article only scratched the surface of this sector, and there are still many things worth exploring further. Interested readers can access quarterly and annual QCEW data down to the 3-digit subsector level on STATS Indiana or Hoosiers by the Numbers (if you want ownership codes as well), or visit the BLS website to get quarterly QCEW data down to the 6-digit industry level.
Notes
- “Hoosier facts and fun,” Indiana Historical Society, https://indianahistory.org/education/education-resources/educator-resources/fun-facts/
- See “Why are some NAICS codes only 5-digits long?” for additional details.
- “QCEW industry codes and titles,” U.S. Bureau of Labor Statistics, https://www.bls.gov/cew/classifications/industry/industry-titles.htm
- Learn more about the disclosure rules at: Rachel Justis, “What do you mean the data are suppressed? Understanding the ins and outs of QCEW disclosure rules,” InContext, July 2008, https://www.incontext.indiana.edu/2008/july-august/2.asp
- Use the QCEW NAICS hierarchy crosswalk from BLS if you want to explore the different versions in more depth.
- “Industries at a glance—Couriers and messengers: NAICS 492,” U.S. Bureau of Labor Statistics, https://www.bls.gov/iag/tgs/iag492.htm
- These groupings come from: Christine Nolan, Thayr Richey and Jerry Conover, “Applying cluster insights in a rural region,” InContext, April 2007, https://www.incontext.indiana.edu/2007/april/1.asp