Employment growth within Indiana's industry sectors

The fastest-growing Hoosier industry sector over the last decade was transportation and warehousing, with a 36.8% growth in employment.
Which industries are experiencing the most employment growth in Indiana? How do Indiana’s industries stack up in terms of employment growth relative to the nation?
This article explores both of these questions, with a special look at the growth momentum of Indiana’s industry sectors, and compares which industries have momentum in Indiana vs. which ones have the most momentum nationally.
For this analysis, we will focus on growth over the past decade, using annual averages from 2011 to 2021. The underlying employment data come from the Quarterly Census of Employment and Wages (QCEW) data set produced by the U.S. Bureau of Labor Statistics. The Indiana Business Research Center calculates the annual averages from these data and publishes them on STATS Indiana.
Standard measures of change
Figure 1 shows both the numeric and percent change in employment for each of Indiana’s industry sectors. In terms of sheer numbers, manufacturing saw the most numeric growth within Indiana, with a gain of 60,455 jobs over the decade (+13%). However, the fastest-growing sector was transportation and warehousing, with a 36.8% growth (or 46,117 more jobs).
Interactive Figure 1: Change in Indiana employment by sector
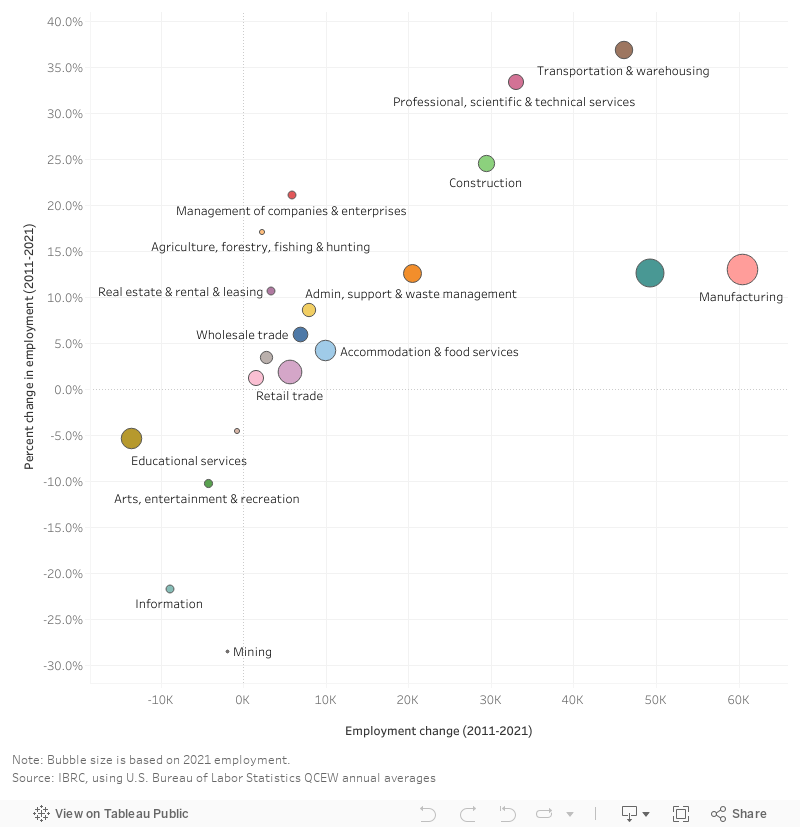
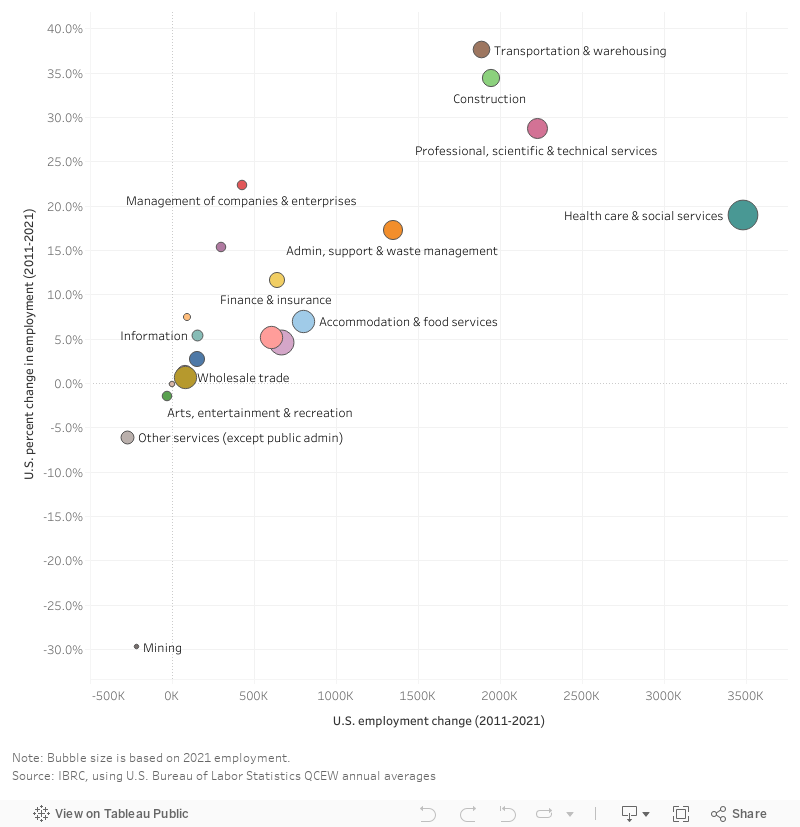
Figure 2 shows these same data at the national level. Here we see health care and social services leading the way in terms of numeric gains, with more than 3.4 million additional jobs over the decade (+19%). Like Indiana, the fastest-growing sector in percentage terms was transportation and warehousing, with a 37.6% growth (or nearly 1.9 million more jobs).
Interactive Figure 2: Change in U.S. employment by sector
These standard measures of numeric and percent change, while standard for a reason, each have their limitations when looked at in isolation. For example, numeric change can “overlook significant growth in smaller industries, while percent change can overemphasize very rapid growth in extremely small industries.”1
Because of this, we will turn our attention to a simple momentum calculation. That will give us a way to rank growth using attributes of both size and speed.
Alternative measure of change: Growth momentum
To calculate momentum, we will resurrect a simple growth momentum calculation fully detailed in an article from the InContext archives.2 Borrowing the concept from physics, “the amount of momentum that an object has is dependent upon two variables: how much stuff is moving and how fast the stuff is moving.”3 In more technical terms:
momentum = mass × velocity
Furthermore, “a fast-moving small object and a larger but more slowly moving object might have the same momentum. If two objects have the same mass, then the one that is moving faster will have the larger momentum. Similarly, if two objects are moving at the same speed, then the object with more mass will have the larger momentum.”4
To put employment growth into momentum terms, we can substitute numeric growth for mass and the growth rate for velocity:
momentum = numeric change in employment × percent change in employment
If an industry is declining, the growth momentum is then multiplied by -1 to capture the fact that it has “negative growth.”
Table 1 shows the momentum calculations for Indiana and ranks for both Indiana and the nation. In Indiana, the three industry sectors with the most employment growth momentum over the decade are
- Transportation and warehousing
- Professional, scientific and technical services
- Manufacturing
Nationwide, the leading sectors on this measure are
- Transportation and warehousing
- Construction
- Health care and social services
Table 1: Employment growth momentum by industry sector, 2011 to 2021
| Sector label | Indiana | U.S. | |||
|---|---|---|---|---|---|
| Rank | Momentum value | Numeric change | Percent change | Rank | |
| Momentum leaders | |||||
| Transportation & warehousing | 1 | 16,988 | 46,117 | 37% | 1 |
| Professional, scientific & technical services | 2 | 11,012 | 32,981 | 33% | 4 |
| Manufacturing | 3 | 7,874 | 60,455 | 13% | 10 |
| Construction | 4 | 7,249 | 29,503 | 25% | 2 |
| Health care & social services | 5 | 6,249 | 49,312 | 13% | 3 |
| Admin, support & waste management | 6 | 2,590 | 20,503 | 13% | 5 |
| Management of companies & enterprises | 7 | 1,253 | 5,927 | 21% | 6 |
| Middle of the pack | |||||
| Finance & insurance | 8 | 688 | 7,982 | 9% | 7 |
| Accommodation & food services | 9 | 418 | 9,971 | 4% | 8 |
| Wholesale trade | 10 | 413 | 6,896 | 6% | 14 |
| Agriculture, forestry, fishing & hunting | 11 | 392 | 2,294 | 17% | 13 |
| Real estate & rental & leasing | 12 | 367 | 3,427 | 11% | 9 |
| Slow and slower | |||||
| Retail trade | 13 | 106 | 5,725 | 2% | 11 |
| Other services (except public admin) | 14 | 96 | 2,796 | 3% | 19 |
| Public administration | 15 | 18 | 1,499 | 1% | 15 |
| Losing momentum | |||||
| Utilities | 16 | -33 | -731 | -4% | 17 |
| Arts, entertainment & recreation | 17 | -435 | -4,252 | -10% | 18 |
| Mining | 18 | -534 | -1,874 | -28% | 20 |
| Educational services | 19 | -733 | -13,572 | -5% | 16 |
| Information | 20 | -1,914 | -8,825 | -22% | 12 |
![]() Download the full table including the U.S. momentum calculations »
Download the full table including the U.S. momentum calculations »
Source: IBRC, using U.S. Bureau of Labor Statistics QCEW annual averages
Unsurprisingly, manufacturing has much higher momentum in Indiana (ranking #3) relative to the U.S. (#10). Indiana manufacturing grew by 13.0% over the decade compared to the U.S. rate of 5.2%. Moreover, manufacturing comprises 17% of total employment in the state relative to 9% nationwide.
It is worth noting that transportation and warehousing experienced steady gains throughout the decade, so its high momentum is not solely due to changes brought about by the COVID-19 pandemic. However, the same cannot be said for a couple of the declining sectors. For example, educational services employment in Indiana held relatively steady prior to declines that began in 2020. Likewise, the arts and entertainment sector—both nationally and in Indiana—has not fully recovered from the huge losses driven by the pandemic.
Conclusion
Borrowing the concept of momentum from physics provides us with a useful framework for exploring and comparing growth among industry sectors. The transportation and warehousing sector stands out in terms of having lots of employment momentum both nationally and in Indiana. Look for an article diving deep into that sector in the next issue of InContext.
Notes
- “Measuring the growth momentum of employment in Indiana,” InContext, May 2001, https://www.incontext.indiana.edu/2001/may01/articles/3_business.pdf
- Ibid.
- “Momentum and Its Conservation - Lesson 1 - The Impulse-Momentum Change Theorem,” The Physics Classroom, https://www.physicsclassroom.com/class/momentum/Lesson-1/Momentum
- See note 1.