COVID-19 and the leisure and hospitality supersector in Indiana: Where were we and where are we now?

Given the shutdown of economic activities and social distancing measures to contain the pandemic, it is not surprising that leisure and hospitality suffered the most significant job losses.
The COVID-19 pandemic caused an extensive and catastrophic economic crisis in state and local economies throughout the United States. As the virus started to spread in March 2020, governors and mayors across the U.S. scrambled to contain its spread by shutting down businesses and dramatically reducing capacity for social events, including restaurants, places of worship and sporting events.
In Indiana, the seasonally adjusted unemployment rate was at 3.2% in February 2020 prior to the pandemic, peaked at 16.9% in April 2020, and stood at 4.6% in December 2020. Between February and April, a total of 570,474 jobs were lost. Although jobs have rebounded since the peak drop in April, total employment was still lower in December at 3,190,041 compared to 3,250,571 in February. There was a consistent drop in employment across all major supersectors between March and April, but leisure and hospitality was hit particularly hard. Prior to the pandemic in February 2020, this supersector made up about 10% of nonfarm payroll employment in Indiana and experienced a steep decline by losing 126,400 jobs between March and April of 2020.
Employment and job losses in Indiana
This article uses the BLS’s Current Employment Statistics (CES) data for nonfarm payroll (seasonally adjusted), aggregated to 11 supersectors, to examine monthly employment in the state. These supersectors are classified as either goods-producing or service-providing. Goods-producing includes: mining and logging, construction, and manufacturing. Service-providing supersectors include trade, transportation and utilities; information; financial activities; professional and business services; education and health services; leisure and hospitality; other services; and government. Monthly employment by supersector is displayed in Figure 1. The average employment between June to August and between September to December are also included to provide a snapshot of the employment trajectory as the state economy continued to reopen toward the latter portion of 2020. Trade, transportation and utilities is the largest supersector, followed by manufacturing. Leisure and hospitality ranks sixth among the 11 supersectors.
Figure 1: Employment in Indiana supersectors during COVID-19 pandemic
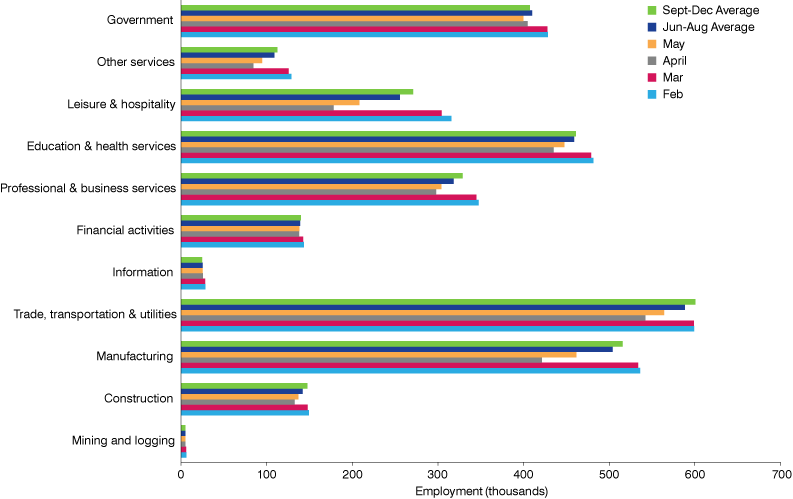
Source: Current Employment Statistics (seasonally adjusted), U.S. Bureau of Labor Statistics
Employment started to fall in all supersectors in March when the COVID-19 pandemic began spreading across the U.S., but the steepest decline occurred in April. Table 1 provides a snapshot of employment losses in April relative to March 2020. Figures 2 and 3 show monthly change and percentage change in employment, respectively, for each supersector. The two supersectors that have been hit the hardest in terms of job numbers are leisure and hospitality and manufacturing. Indiana jobs dropped a staggering 41.5% (126,400 job losses) between March and April in the leisure and hospitality supersector. Meanwhile, the least-impacted supersector—financial services—lost 3.4% (4,900 job losses) in April.
Table 1: Change in employment in Indiana in April 2020 due to the COVID-19 pandemic
| Supersector | March employment (thousands) | April employment (thousands) | Net change (thousands) | Percent change |
|---|---|---|---|---|
| Mining and Logging | 5.9 | 5.1 | -0.8 | -13.6 |
| Construction | 147.8 | 132.7 | -15.1 | -10.2 |
| Manufacturing | 533.7 | 421.4 | -112.3 | -21.0 |
| Trade, Transportation and Utilities | 598.9 | 542.3 | -56.6 | -9.5 |
| Information | 28.1 | 25.3 | -2.8 | -10.0 |
| Financial Activities | 142.7 | 137.8 | -4.9 | -3.4 |
| Professional and Business Services | 344.9 | 297.8 | -47.1 | -13.7 |
| Education and Health Services | 478.9 | 435.0 | -43.9 | -9.2 |
| Leisure and Hospitality | 304.4 | 178.0 | -126.4 | -41.5 |
| Other Services | 125.5 | 84.5 | -41.0 | -32.7 |
| Government | 427.6 | 404.6 | -23.0 | -5.4 |
Source: Current Employment Statistics (seasonally adjusted), U.S. Bureau of Labor Statistics
Figure 2: Employment change in Indiana supersectors due to the COVID-19 pandemic
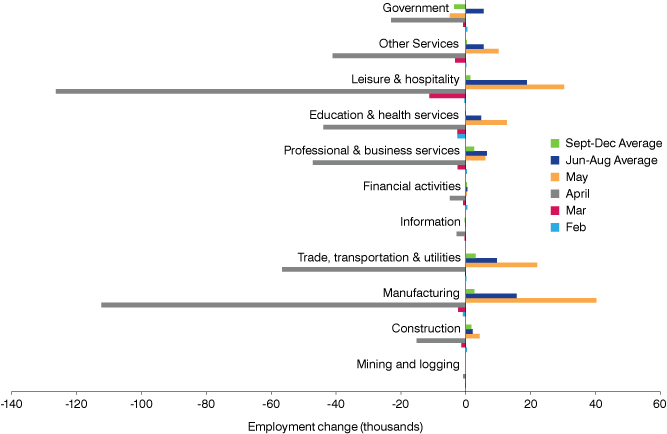
Note: Averages shown indicate monthly averages, not the average total change for that time period.
Source: Current Employment Statistics (seasonally adjusted), U.S. Bureau of Labor Statistics
Figure 3: Percent change in Indiana supersector employment during the COVID-19 pandemic
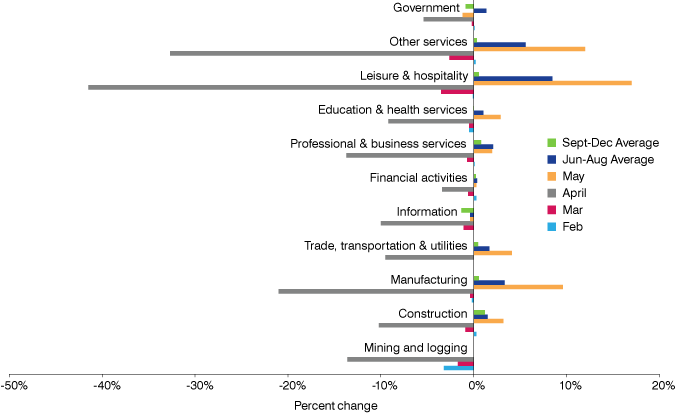
Note: Averages shown indicate monthly averages, not the average total change for that time period.
Source: Current Employment Statistics (seasonally adjusted), U.S. Bureau of Labor Statistics
Jobs started to recover in May across all supersectors, except in information and government. However, even with job growth in most supersectors after May, the employment numbers at the end of the year were not yet on par with pre-COVID-19 levels in February. The most recent employment data at the time of this writing still show lower employment levels across all supersectors for April 2021 compared to February 2020. In leisure and hospitality specifically, employment was at 275,100 in April 2021—which is 40,500 fewer jobs compared to the pre-pandemic level in February 2020.
Leisure and hospitality: Job losses and economic impact to the state
With the widespread shutdown of economic activities, along with social distancing measures to contain the pandemic instituted by state and local governments, it is not surprising that the leisure and hospitality supersector suffered the most significant job losses. In February 2020, jobs in this supersector stood at 315,600, fell by 3,500 jobs in March and took a deep dive in April with only 178,000 jobs remaining. The supersector started rebounding in May as local economies resumed activities, gaining 30,300 jobs with continued increases up until October. Slight declines occurred in November and December. In December, employment in leisure and hospitality was 270,000. This was still 45,600 fewer jobs than February’s pre-pandemic level. Between May and December, leisure and hospitality in Indiana gained 61,700 jobs back as the state economy started to recover from the pandemic, while it lost 126,400 jobs at the peak of the unemployment effect of the pandemic between March and April.
The economic impact of job losses in leisure and hospitality at the peak of the employment drop attributable to the COVID-19 pandemic (March to April 2020) was estimated using IMPLAN, which is the leading provider of economic impact data and analytical software. It utilizes an input-output (I-O) economic modeling system which captures inter-sector relationships in a region and calculates how the impact of $1 ripples throughout the regional economy, creating additional expenditures and jobs (i.e., the multiplier effect). Any change in activity from a business generates ripples across multiple industries, impacts supplier businesses and changes household spending. Thus, the impact of any activity within the economy (i.e., state) has wide-ranging effects.
Using the IMPLAN model, we estimated direct, indirect and induced effects of the job losses in the leisure and hospitality supersector. The direct effect is the actual job losses between March and April (126,400 jobs) applied to the I-O multipliers for the impact analysis. The indirect effect captures the drop in business-to-business purchases in the supply chain brought about by the initial drop in employment in the leisure and hospitality supersector. The spending of employees within the supply chain (i.e., household spending of labor income), is known as the induced effect. Ideally, job losses in all the disaggregated categories within leisure and hospitality1 should be utilized for analysis. However, such levels of disaggregation were not available in the CES data. Thus, the aggregated employment number for the leisure and hospitality supersector was utilized, and correspondingly, IMPLAN’s sector aggregation was adjusted to reflect the available data as the input for analysis.
IMPLAN uses annual data to model the pattern of how a change in activity will ripple through the economy. It estimates how the 126,000 job losses in leisure and hospitality will ripple through the economy due to the purchases that this supersector is not making in other industries and the lack of income to households in those industries that would otherwise stimulate household spending. The indirect and induced effects may not happen in that month for a few reasons: (1) the supersector may not make monthly purchases of its intermediate inputs so the shock to the supply chain may not be immediate. They may just not need to restock certain supplies in six months that they would otherwise have to; and (2) households may not change their spending immediately or at all due to stimulus checks/unemployment benefits or even finding other employment.
The analysis assumes that the income is completely lost and essentially cannot be substituted. Therefore, the indirect and induced losses may be more of a trickle. It is important to note that the results of the economic impact analysis represent the impact for the whole year. Depending on how the supersector recovers, in theory, the loss could even be “made up” later in the year due to increases in domestic tourism. The indirect and induced results are the effects that would be expected to be otherwise supported by the level of employment that is being analyzed as a loss.2
Table 2: Estimated economic impact of job losses in the leisure and hospitality supersector between March and April 2020 due to the COVID-19 pandemic
| Impact type | Economic impact indicator | ||
|---|---|---|---|
| Employment | Labor income (billions) | Output (billions) | |
| Direct | -126,400 | -$3.31 | -$9.31 |
| Indirect | -21,848 | -$1.32 | -$3.72 |
| Induced | -19,896 | -$1.08 | -$3.18 |
| Total | -168,144 | -$5.71 | -$16.21 |
Source: Estimates using IMPLAN economic modeling software
Table 2 shows the estimated economic impact of the 126,400 job losses between March and April 2020 in the leisure and hospitality supersector for Indiana. The drop in economic activity within the supply chain yields 21,848 job losses among suppliers. The reduction in household spending from the loss in business activity reduces employment by 19,896. A total of 168,144 estimated jobs for the year were lost in Indiana from the initial drop in employment in the leisure and hospitality supersector.
The total decrease in labor income (includes wages, benefits and payroll taxes) for the year was estimated at about $5.71 billion (or roughly $475.8 million per month). The total decrease in output for the year was estimated at $16.21 billion (or roughly $1.35 billion per month).
In addition to the impact on employment, labor income and output, IMPLAN also produces estimates of the impact on tax revenues across all levels of government for all affected industries due to job losses in the leisure and hospitality supersector. Table 3 reports on the tax implications of the 126,400 job losses in leisure and hospitality. These job losses precluded a total (direct, indirect and induced) impact of $887.2 million in tax revenue to state and local governments and an additional $540.4 million to the federal government. It should be noted that these are not necessarily all “lost” revenues as the value of the impact is not necessarily net job losses in the state.
Table 3: Estimated tax impacts of job losses in the leisure and hospitality supersector between March and April 2020 due to the COVID-19 pandemic
| Impact Type | State and Local (millions) | Federal (millions) |
|---|---|---|
| Direct | -$563.76 | -$281.78 |
| Indirect | -$37.43 | -$244.63 |
| Induced | -$286.01 | -$14 |
| Total | -$887.20 | -$540.41 |
Source: Estimates using IMPLAN economic modeling software
The leisure and hospitality supersector: Where are we now?
In the previous section, the adverse impact of the COVID-19 pandemic on the leisure and hospitality supersector and the subsequent ripple effects on employment across all supersectors and tax revenues for local, state and the federal government were presented. By summer 2020, state-mandated shutdowns and social distancing rules were relaxed. As businesses continue to open and start to operate at (near) capacity, as social distancing measures are relaxed, and as the impact of the various stimulus packages starts to trickle down, it will be interesting to see the speed at which each supersector recovers in 2021 and how long it will take them to be at their pre-COVID-19 levels, if at all. To provide a comprehensive view of how the overall year (2020) looked, the economic impact of the job gains between May and December was also estimated using IMPLAN, and the results are reported in Table 4.
Table 4: Estimated economic impact of job gains in the leisure and hospitality supersector between May and December 2020
| Impact type | Economic impact indicator | ||
|---|---|---|---|
| Employment | Labor income (billions) | Output (billions) | |
| Direct | 61,700 | $1.65 | $4.63 |
| Indirect | 9,965 | $0.66 | $1.78 |
| Induced | 10,761 | $0.61 | $1.74 |
| Total | 82,426 | $2.93 | $8.15 |
Source: Estimates using IMPLAN economic modeling software
The reopening of businesses and economic activities in Indiana in May brought about an increase in employment in the leisure and hospitality supersector of 61,700 (between May and December). This would have supported a total of 82,426 jobs for the year. The total increase in labor income from these jobs’ recovery was estimated at $2.93 billion for the year (or roughly $243.76 million per month). The total increase in output from the recovery in the leisure and hospitality supersector between May and December was estimated to be $8.15 billion for the year (or roughly $679.21 million per month).
The associated tax impact of the gains from the recovery between May and December are reported in Table 5. The tax implications of the 61,700 job gains in leisure and hospitality generated a total of $181.2 million (direct, indirect and induced) tax revenue to state and local governments and an additional $447.4 million to the federal government. It is important to note that not all of these are necessarily “new” revenues as the value of the impact is not necessarily net new jobs.
Table 5: Estimated tax impacts of job gains in the leisure and hospitality supersector between May and December 2020
| Impact type | State and local (millions) | Federal (millions) |
|---|---|---|
| Direct | $57.59 | $314.11 |
| Indirect | -$114.61 | $240.74 |
| Induced | $238.25 | -$77.42 |
| Total | $181.23 | $477.43 |
Source: Estimates using IMPLAN economic modeling software
It is important to note that a one-to-one comparison of the economic impact losses in Table 2 and the gains in Table 4 is inappropriate. IMPLAN calculates an estimate of economic impact for the year for a one-time shock. As previously stated, a one-time adverse economic shock in the form of job losses could be made up later in the year. Similarly, a one-time positive economic shock in the form of job gains can theoretically “be lost” later in the year. Thus, we should look at these estimates separately as indicators of the magnitudes of potential losses (or gains) from the leisure and hospitality supersector in Indiana in 2020 due to the pandemic, assuming there is no recovery (or downturn) that occurs later in the year.
These economic impact results provide information to assist in private and public decision-making and responses related to the COVID-19 pandemic. This is particularly useful for policymakers as they develop plans to facilitate the ongoing recovery.
Notes
- Arts, entertainment and recreational services (includes 10 industries; industry codes 496-506) and food and accommodation services (includes 5 industries; industry codes 507-511).
- While the authors determined the supersector aggregation and usage of job losses data from the CES (BLS) and estimated the impacts using IMPLAN, economic language and other supporting services was provided by IMPLAN.