Do counties with high social capital show less COVID-19 spread? It's complicated
Regions with high social capital are likely to have strong social networks, so individuals may be more inclined to protect others’ health by wearing masks and maintaining physical distance in public.
One of the most necessary prerequisites for good governance is trust. Trust in government, institutions and individuals is paramount to a well-functioning and prosperous society. Indeed, the COVID-19 pandemic and the uneven government responses around the world have made this even more apparent. We can use indicators of social capital—defined by the Organization for Economic Cooperation and Development (OECD) as networks, shared norms and values that facilitate cooperation among groups—as proxies for trust in a region.
Why is social capital an important concept to measure? Though a consensus is yet to be reached on the precise benefits of social capital, studies have found associations between social capital and economic growth, resilience, entrepreneurship and other desirable economic outcomes. Researchers have even found public health implications: A 2015 study from Taiwan related to an influenza outbreak found that willingness to perform three protective health actions—receiving a vaccine, wearing a mask and washing one’s hands—was associated with a community’s social capital.1
In the context of easing restrictions meant to slow the spread of COVID-19, many scholars have claimed that social capital is critical to keeping infection rates down. Stuti Rawat and Alfred Muluan Wu, writing for the Asia and the Pacific Policy Society, argue that regions with high social capital may be more likely to adhere to guidelines regarding non-pharmaceutical interventions like mask-wearing and social distancing to counteract the spread of the virus, even when such measures aren’t government-mandated.2 This makes intuitive sense—regions with high social capital are likely to have strong social networks, so individuals may be more inclined to protect others’ health by wearing masks and maintaining physical distance in public.
Social capital in Indiana counties
More empirical study is needed to tease out exactly how social capital may help in the fight against the pandemic. In the meantime, though, we can examine the social capital landscape within the state of Indiana and consider the potential impacts on COVID-19 spread and other outcomes. As part of a future update to its Innovation Index 2.0, the IBRC is producing various measures of social capital organized around five themes:
- Literacy and altruism
- Public participation and voting
- Informal interaction
- Shared norms
- Crime
Table 1 summarizes the components of the sub-indexes. We transformed and combined the measures to construct five sub-indexes and an overall headline index equal to the average of the sub-indexes, similar to the methods used for the Innovation Index itself.
Table 1: Components of social capital sub-indexes
| Sub-index | Variables |
|---|---|
| Literacy and Altruism | Literacy rate, local media, employment in outreach and social assistance industries, philanthropy, volunteerism |
| Public Participation and Voting | Nonprofit organizations, voting |
| Informal Interaction | Homeownership rate, non-family households, local-to-traded industry ratio, residential stability, single-parent households, suicide rate |
| Shared Norms | Foreign-born population, foreign-born naturalized citizen population, median age, non-English speaking households, political homogeneity, racial diversity, religious adherence and homogeneity, socioeconomic inequality |
| Crime | Violent and property crime per capita |
Source: Indiana Business Research Center
We present the data as indexes for simplicity and comparability between counties. The indexes are constructed so that 100 is the nationwide average; thus, counties with a social capital index greater than 100 have higher social capital than the average U.S. county.
In Indiana, the headline social capital index ranges from 90.7 (Jennings County) to 128.4 (Wells County). Table 2 shows the five highest- and lowest-scoring counties in the state by headline index and the constituent sub-indexes. The top five counties score higher than the U.S. average on almost all sub-indexes. There isn’t much separation between the top- and bottom-five counties on the literacy and altruism or the shared norms sub-indexes, but the other three show significant variation. This is especially true for the crime component; the counties at the low end of the spectrum have much higher instances of property and violent crime per capita than the high social capital counties. Note that Switzerland County did not have data available from our source (the FBI Uniform Crime Reporting statistics) for this component, so it is excluded from the calculation of the headline index for this county only.
Table 2: Top and bottom five Indiana counties by social capital index
| County | Rank | Headline Social Capital Index | Literacy and Altruism | Public Participation and Voting | Informal Interaction | Shared Norms | Crime |
|---|---|---|---|---|---|---|---|
| Wells | 1 | 128.4 | 115.3 | 144.0 | 119.0 | 117.1 | 146.7 |
| Pike | 2 | 123.1 | 108.9 | 147.1 | 118.9 | 107.9 | 132.9 |
| Hamilton | 3 | 122.6 | 101.8 | 112.5 | 144.6 | 103.3 | 150.8 |
| Franklin | 4 | 120.2 | 89.2 | 104.8 | 128.9 | 114.6 | 163.6 |
| White | 5 | 120.0 | 103.1 | 91.0 | 121.0 | 102.4 | 182.5 |
| Clark | 88 | 95.0 | 104.4 | 86.3 | 98.9 | 101.0 | 84.4 |
| Lake | 89 | 93.7 | 102.8 | 92.4 | 88.9 | 100.4 | 84.0 |
| Marion | 90 | 92.3 | 106.8 | 102.6 | 74.3 | 97.3 | 80.7 |
| Switzerland | 91 | 90.8 | 85.8 | 85.6 | 92.6 | 99.0 | n/a |
| Jennings | 92 | 90.7 | 90.8 | 75.9 | 90.3 | 109.0 | 87.3 |
Source: Author’s calculations
Marion County, ranked 90th out of 92 counties in the headline social capital index, is somewhat of an outlier, as its informal interaction index is much lower than the other counties. This has to do with the low rate of homeownership in that county, as well as the high rate of households made up of non-family units and single-parent households. This is the case for many metropolitan areas around the country.
Social capital and COVID-19
As mentioned before, there are various ways that higher social capital could theoretically lower the spread of COVID-19. Whether it actually does so is up for debate, and this is complicated given that how one measures social capital is highly subjective. The IBRC’s measures of social capital are not all-encompassing. There are certainly unobserved characteristics of social capital that aren’t accounted for in our measures.
That being said, we do find some evidence that our measures of social capital have a relationship with COVID-19 cases. A linear regression of the social capital sub-indexes on per capita cases in U.S. counties (as of July 30, 2020) show that each of the sub-indexes, except for informal interaction, are negatively associated with per-capita cases. The magnitude of this relationship, however, isn’t great; for example, a one-unit increase in the shared norms sub-index is associated with a decrease in 0.27 cases per 100,000, holding all other sub-indexes constant. Further, the sub-indexes only account for about 3% of the variation in COVID-19 cases, which is not surprising since there are so many other factors that contribute to the spread of COVID-19 besides our measurements of social capital.
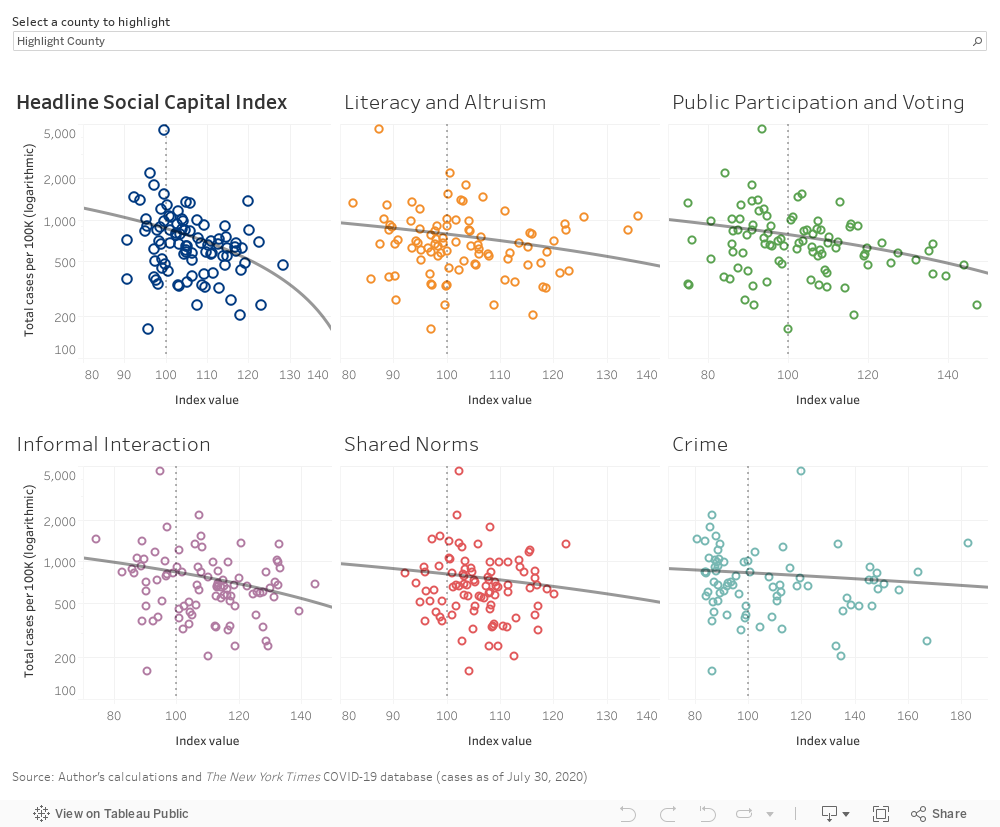
Figure 1 is a scatterplot of the social capital indexes and COVID-19 cases per 100,000 population (as of July 30, 2020) in Indiana counties. The lines highlight the somewhat loose trends between the individual indexes and per capita cases, which are presented on a logarithmic scale for legibility.
Figure 1: COVID-19 cases per 100K and social capital indexes for Indiana counties
Conclusion
The IBRC’s social capital measures are a work in progress, and we continue to refine them as we embark on an update of the Innovation Index. While the concept of social capital isn’t exactly nascent, new themes and methods are constantly emerging and the IBRC’s work reflects this. Regardless, we’ve shown that there is at least some evidence of a relationship between COVID-19 cases and social capital as we measure it. Clearly, though, more research is needed to disentangle how social capital interacts with other characteristics of a community to more completely model its impact on the spread of COVID-19.
Notes
- Chuang, Y. C., Huang, Y. L., Tseng, K. C., Yen, C. H., & Yang, L. H. (2015). Social capital and health-protective behavior intentions in an influenza pandemic. PloS one, 10(4), e0122970. https://doi.org/10.1371/journal.pone.0122970
- Rawat, S., & Wu, A. M. (2020). Why social capital is essential in the fight against COVID-19. Asia and the Pacific Policy Society. www.policyforum.net/why-social-capital-is-essential-in-the-fight-against-covid-19/