Census 2020, COVID-19 and Indiana's response so far—Needs to get better, fast
Answering the census is the right thing to do—especially now that we need to know how many people are in our communities more than ever before.
It all happened so fast—or at least over just a few weeks. The spread of the novel coronavirus across the country and throughout Indiana has accelerated. We are all doing what we can to ensure that our neighbors, friends, relatives and co-workers are safe and that we can stop the spread and break the chain.
But the spread of virus also threw what looked like a monkey wrench into the rollout of Census 2020, the single largest federal program that touches every American and of course, every Hoosier.
In Indiana, Governor Holcomb acted quickly to enact measures to protect public health. With a continuous series of executive orders, beginning March 6, Indiana was put on alert and subsequently a stay-at-home order for nonessential businesses and organizations.
At the same time, the U.S. Census Bureau has suspended and extended certain of its operations for several weeks, with bureau employees now working remotely and hiring for non-response follow-up, update-leave operations and more (view list of operational adjustments).
But the actual response to the census for 2020 has been in the hands of households for a number of weeks, which is very good news. It is clear from the response rates that Americans, and in particular Hoosiers, are still going online or sending in their answers to the census. Indiana was at a 54% response rate as of April 20, which compares favorably to the overall national rate of 51% on that day.
- View the national response rate map
- View current response rates for Indiana counties
- View current response rates for Indiana congressional districts
The not-so-good news is that these self-response rates are still far below what we would expect them to be based on past censuses. Unfortunately, the metric used to measure self-response has changed slightly, so we cannot directly compare the 2020 self-response rates to the daily participation rates from Census 2010 for an accurate “on this day” comparison of response.1 However, the Census Bureau did use the data from 2010 to create self-response numbers for the final rates that are comparable. And we are far enough into census deployment that we should be seeing numbers fairly close to the final rates.2 The problem is, we are not.
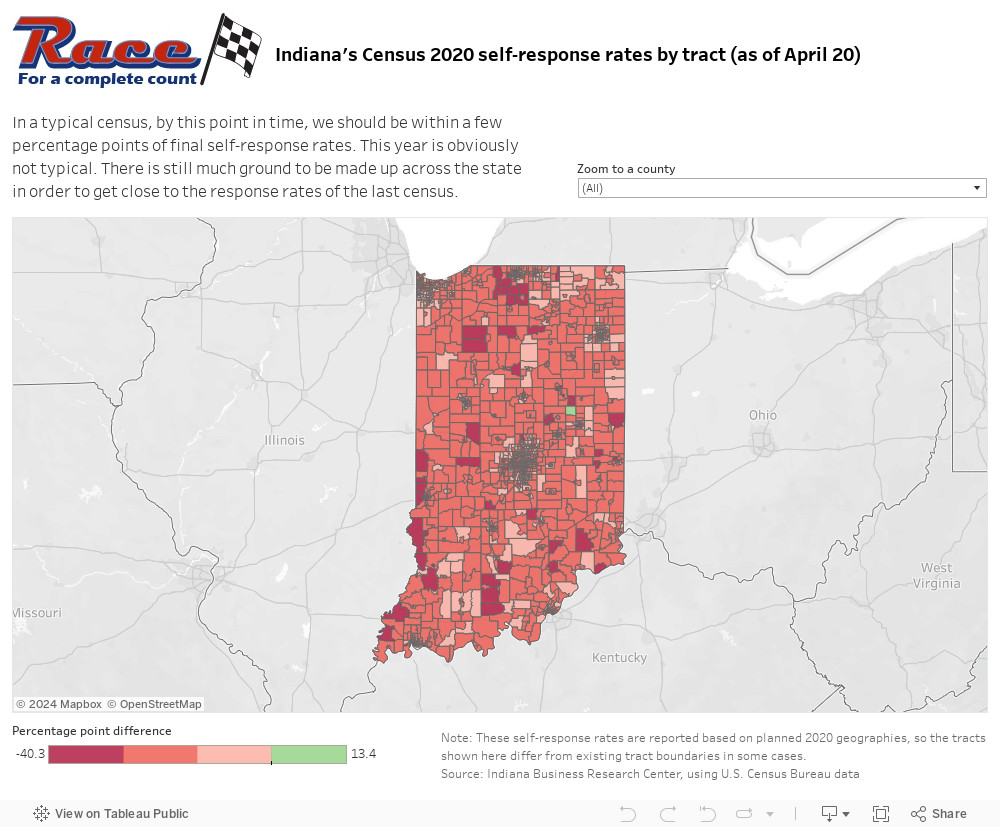
Figure 1 shows the difference between 2020 self-response (as of April 20) with the final self-response rates from Census 2010. Only two tracts in the entire state (one in Delaware County and the other in Hamilton County) have surpassed their response rates from the prior census. In fact, 94% of tracts trail their 2010 rates by more than 10 percentage points.
Figure 1: How do Census 2020 self-response rates compare to the last census?
Editor's note: View the most current visualizations on the Census in Indiana response rate page »
While update-leave operations (i.e., hand-delivered forms) have been postponed due to COVID-19, which would impact participation in some of our most rural areas there appears to be a broader lack of response statewide.
Now's the time
Indiana has always been a good responder to the decennial census, our once-a-decade call to be counted. And even in the midst of a pandemic that is upending lives, making people sick and causing death, we need to show our grit and our practicality. Answering the census is the right thing to do—especially now that we need to know how many people live in our communities more than ever before.
Learn more about Indiana’s efforts to ensure all Hoosiers are counted and access additional response rate visualizations at the Census in Indiana website. And if you haven’t done it already, answering the census NOW is critical. Every Hoosier household needs to respond NOW. Find the invitation or reminder letters and go online or call it in, but do it NOW. That’s how we will make sure every Hoosier is counted during a time all of us will remember.
Notes
- According to the Census Bureau's technical documentation, “self-response rates” do not change to reflect vacant housing or housing units with addresses determined to be undeliverable by the post office, while the “participation rates” from 2010 did remove addresses identified as undeliverable from the denominator. Thus, self-response rates will naturally result in lower numbers relative to participation rates. As an example, Indiana's 2010 participation rate was 79%, while its 2010 self-response rate was 70%.
- For Census 2010, Indiana's April 20, 2010, participation rate was 76%—very close to its final participation rate of 79%. See Rachel M. Justis, "Census 2010 Participation Rates," Indiana Business Review, Summer 2010, www.ibrc.indiana.edu/ibr/2010/summer/article4.html.