Is population growth in other states dominated by a single metro—or is that just us?

Growth in the Indy metro accounted for more than three-quarters of Indiana's statewide growth since 2010.
Indiana’s population growth is concentrated in the Indianapolis-Carmel-Anderson metro area. In fact, we discuss this at least annually (most recently: “Whitestown and Westfield top list of Indiana's fastest-growing communities”).
This article takes a wider perspective to explore the extent to which uneven distributions of population growth are occurring in other states. We will focus on change since 20101 to get a feel for what has happened since the Great Recession ended, but the figures are interactive, so feel free to adjust the base year to explore more recent changes as well.
The geographies
While metro areas usually receive most of the attention, for the purposes of this article, we’re going to include both metropolitan and micropolitan statistical areas (based on the latest statistical area definitions released in September 2018) in order to have a broader picture of change across the states.
As a refresher, statistical areas are defined by high degrees of social and economic integration with an urbanized core county (measured by commuting ties). Metropolitan areas have at least one urbanized core with at least 50,000 people, while micropolitan areas have an urban core with between 10,000 and 50,000 people. To give us a feel for this landscape nationwide, Figure 1 shows both total population in 2018 and percent change.
Figure 1: Population in U.S. metropolitan and micropolitan statistical areas
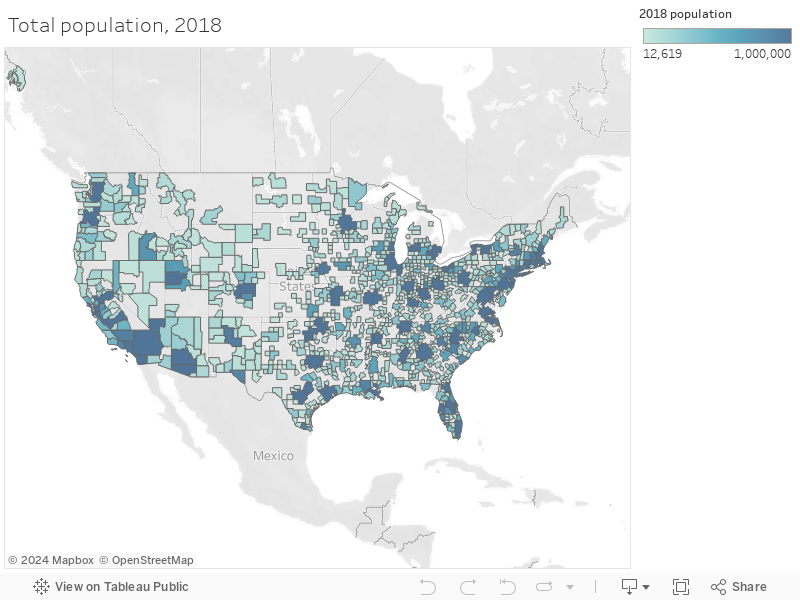
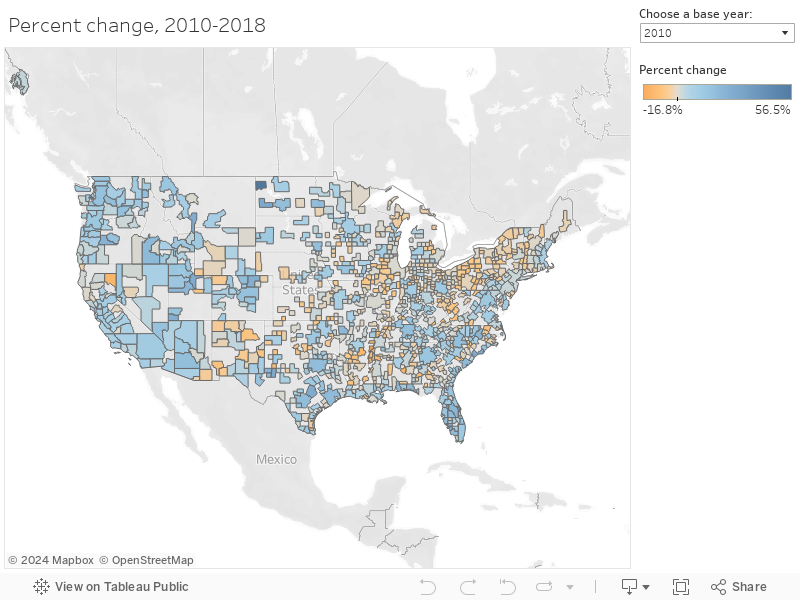
Source: IBRC, using U.S. Census Bureau population estimates
In all, 94 percent of the U.S. population reside in either a metro or micropolitan area (with metropolitan areas accounting for 86 percent of the total U.S. population). Table 1 and Table 2 show the top five and bottom five statistical areas in terms of numeric and percentage growth since 2010.
Table 1: Top 5 population changes
| Most growth since 2010 | |||
|---|---|---|---|
| Region | 2018 population | Change | Percent change |
| Dallas-Fort Worth-Arlington, TX | 7,470,158 | 1,077,899 | 16.9% |
| Houston-The Woodlands-Sugar Land, TX | 6,997,384 | 1,049,975 | 17.7% |
| Phoenix-Mesa-Chandler, AZ | 4,857,962 | 653,224 | 15.5% |
| Atlanta-Sandy Springs-Alpharetta, GA | 5,949,951 | 647,248 | 12.2% |
| Miami-Fort Lauderdale-Pompano Beach, FL | 6,198,782 | 615,235 | 11.0% |
| Most growth (%) since 2010 | |||
| Williston, ND | 35,350 | 12,762 | 56.5% |
| The Villages, FL | 128,754 | 34,476 | 36.6% |
| Myrtle Beach-Conway-North Myrtle Beach, SC-NC | 480,891 | 102,569 | 27.1% |
| Dickinson, ND | 31,916 | 6,773 | 26.9% |
| Midland, TX | 178,331 | 36,537 | 25.8% |
Source: IBRC, using U.S. Census Bureau population estimates
Table 2: Bottom 5 population changes
| Largest declines since 2010 | |||
|---|---|---|---|
| Region | 2018 population | Change | Percent change |
| Pittsburgh, PA | 2,324,743 | -32,343 | -1.4% |
| Youngstown-Warren-Boardman, OH-PA | 538,952 | -25,876 | -4.6% |
| Cleveland-Elyria, OH | 2,057,009 | -18,472 | -0.9% |
| Flint, MI | 406,892 | -18,059 | -4.2% |
| Charleston, WV | 260,342 | -17,455 | -6.3% |
| Largest declines (%) since 2010 | |||
| Helena-West Helena, AR | 18,029 | -3,647 | -16.8% |
| Clarksdale, MS | 22,628 | -3,478 | -13.3% |
| Selma, AL | 38,310 | -5,550 | -12.7% |
| Greenville, MS | 45,063 | -6,033 | -11.8% |
| Susanville, CA | 30,802 | -4,030 | -11.6% |
Source: IBRC, using U.S. Census Bureau population estimates
Growth by state
Figure 2 allows us to look at each state individually to visualize the population change across its metro and micropolitan areas in both numeric and percentage terms. With an increase of more than 156,000 people since 2010, we see the Indy region’s dominance in terms of the sheer number of new people (as illustrated in the bubble chart), though Lafayette-West Lafayette did surpass its rate of change by 1 percentage point (as shown in the bar chart).
Figure 2: Statistical area population change by state
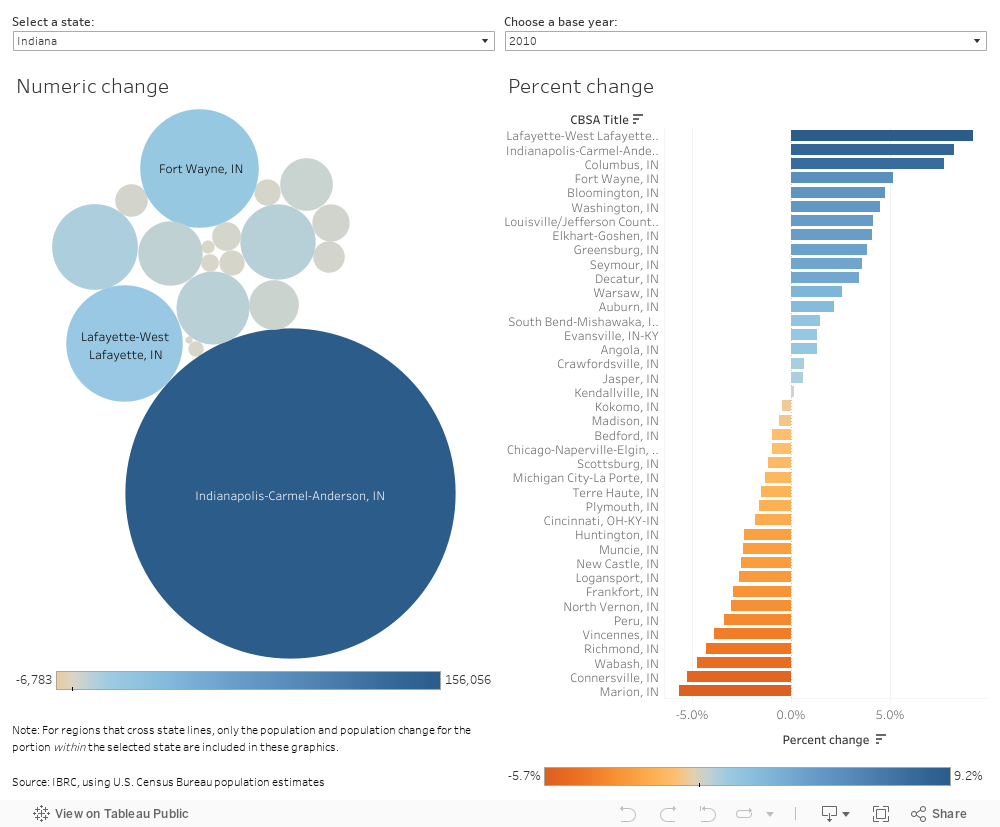
There is a lot of data to digest in Figure 2, but we do find that Indiana is not alone in its uneven distribution of population growth. A quick look at our four neighboring states illustrates this point. Columbus dominated Ohio’s growth in both numeric and percentage terms, and only a few of the Illinois statistical areas grew while the vast majority declined. Meanwhile, Michigan and Kentucky had more evenly distributed population gains since 2010.
Put another way, growth in the Indianapolis-Carmel-Anderson metro accounted for 77.5 percent of Indiana’s statewide growth between 2010 and 2018—ranking the metro at #20 nationwide on this measure (see Table 3). Nine regions in eight states exceed 100 percent on this “percent of state growth” measure, which indicate that growth in these metros was offset by population losses in other parts of those states.
Table 3: Top 20 regions as a percent of state’s total growth, 2010 to 2018
| Rank | Region | State name |
Regional growth* |
Total state growth |
Percent of state’s total growth |
|---|---|---|---|---|---|
| 1 | Burlington-South Burlington, VT | Vermont | 9,549 | 419 | 2,279.0% |
| 2 | Portland-South Portland, ME | Maine | 21,516 | 10,772 | 199.7% |
| 3 | New York-Newark-Jersey City, NY-NJ-PA | New York | 241,162 | 142,129 | 169.7% |
| 4 | Gulfport-Biloxi, MS | Mississippi | 26,675 | 15,994 | 166.8% |
| 5 | Columbus, OH | Ohio | 200,180 | 150,115 | 133.4% |
| 6 | New York-Newark-Jersey City, NY-NJ-PA | New Jersey | 140,287 | 108,896 | 128.8% |
| 7 | Kansas City, MO-KS | Kansas | 65,338 | 53,292 | 122.6% |
| 8 | Philadelphia-Camden-Wilmington, PA-NJ-DE-MD |
Pennsylvania | 114,223 | 95,902 | 119.1% |
| 9 | Memphis, TN-MS-AR | Mississippi | 17,560 | 15,994 | 109.8% |
| 10 | Providence-Warwick, RI-MA | Rhode Island | 3,377 | 3,377 | 100.0% |
| 10 | Washington-Arlington-Alexandria, DC-VA-MD-WV |
District of Columbia |
97,370 | 97,370 | 100.0% |
| 12 | Fayetteville-Springdale-Rogers, AR | Arkansas | 83,755 | 91,847 | 91.2% |
| 13 | Minneapolis-St. Paul-Bloomington, MN-WI | Minnesota | 267,380 | 300,336 | 89.0% |
| 14 | Boston-Cambridge-Newton, MA-NH | Massachusetts | 288,164 | 335,718 | 85.8% |
| 15 | Phoenix-Mesa-Chandler, AZ | Arizona | 653,224 | 763,872 | 85.5% |
| 15 | Albuquerque, NM | New Mexico | 26,353 | 30,840 | 85.5% |
| 17 | Las Vegas-Henderson-Paradise, NV | Nevada | 279,003 | 331,928 | 84.1% |
| 18 | Atlanta-Sandy Springs-Alpharetta, GA | Georgia | 647,248 | 807,665 | 80.1% |
| 19 | Des Moines-West Des Moines, IA | Iowa | 83,618 | 105,378 | 79.4% |
| 20 | Indianapolis-Carmel-Anderson, IN | Indiana | 156,056 | 201,442 | 77.5% |
* For regions that cross state lines, only the population change for the portion within the selected state is included.
Note: States experiencing population decline were excluded.
Source: IBRC, using U.S. Census Bureau population estimates
Summary
The Indianapolis-Carmel-Anderson metro area has grown by 8.2 percent between July 2010 and July 2018. This estimated growth of 156,056 makes up a very significant 77.5 percent of Indiana’s total growth of 201,442. As Hoosiers, some celebrate the strength of a strong capital city, while others bemoan the increasing concentration, perhaps seeing it as a signal that other areas are struggling to keep up. While there are valid points on both sides of that discussion, it is worthwhile to keep in mind that Indiana is not alone in this phenomenon.
Notes
- These data come from the 2018 vintage of the population estimates and are based on July 1 of each year. They are aggregated up from the county level to the September 2018 definitions of the statistical areas.