Career and technical education: Outcomes on employment, wages and industry

Of high school graduates who took at least one CTE course, 64 percent were employed in Indiana five and a half years later.
Career and Technical Education (CTE) represents one part of Indiana’s efforts to prepare students for careers in high-wage, high-demand occupations. Primarily focused on high school students, CTE currently includes courses in six program areas:
- Agricultural education
- Business and information technology
- Engineering and technology
- Family and consumer sciences
- Health science
Trade and industrial education
Through CTE, students can learn about potential career options and have the opportunity to learn applicable skills, earn industry certifications and gain college credits.
Analyses of outcomes for Indiana CTE participants are promising, but often tend to focus on educational outcomes (assessment exams, graduation rates or enrollment in college) or credentials earned (certificates and licenses). Analysis of wage records for Indiana employers yields additional insight on the employment status, wages and industries of graduated CTE participants.
Summary of findings
Long-term outcomes are defined as being 22 quarters after last CTE participation (see the 2010-2011 cohort discussion), while short-term outcomes are 10 quarters after (see the 2013-2014 cohort discussion).
Long-term outcomes
Of high school graduates who took at least one CTE course, 64 percent were employed in Indiana 22 quarters later.
Those that were employed were more likely to work in manufacturing and the health care and social assistance sectors. They were less likely to work in retail trade and accommodation and food services.
Short-term outcomes
Rates of college enrollment, employment and industry of employment differ depending on the number of CTE courses taken and the subject areas studied.
CTE-participating high school graduates who took five or more CTE courses were more likely to be employed in Indiana 10 quarters later compared to all CTE-participating graduates (64 percent vs. 58 percent).
Participants who focused on trade and industrial education had relatively high rates of employment in Indiana (67 percent) and low rates of enrollment in public Indiana colleges (19 percent) in the 2015-2016 school year.
-
Participants who focused on health sciences or engineering and technology had higher rates of enrollment in Indiana public colleges (42 percent and 37 percent, respectively).
-
Compared to 22- to 24-year-old workers overall, CTE-participating graduates appear more likely to be working in industries related to the CTE subject areas they focused on.
About the data
Two cohorts are used to measure employment outcomes for CTE participants. The first is the set of nearly 37,000 high school graduates whose last CTE course was in the 2010-2011 school year, and who were 18 to 19 years old at the end of that term. Graduation dates are not available in this data, so these criteria are intended to approximate the set of CTE participants who graduated from high school in that school year. These data lack detail on the number of CTE courses taken and their subject matter.
A second cohort of over 40,000 high school graduates (based on the 2013-2014 school year) is used to estimate shorter-term employment outcomes. Data for this cohort include more detail on the number of CTE courses taken and the subject matter of each CTE course.
Because these cohorts are defined regardless of college attendance, and because the short-term outcomes are likely to be influenced by college attendance, rates of enrollment in Indiana public colleges for the 2013-2014 cohort are also presented for context (in Figure 5).
Typically, analyses of CTE participants focus on “CTE concentrators,” a term for students who earn six or more credits in a CTE pathway. Because the data used in this analysis lack reliable information on credit hours for years before 2013-2014, the number of courses a student completed is used to identify students with more intensive CTE participation. Approximately 10 percent of the 2013-2014 cohort completed five or more CTE courses (see Figure 1).
Figure 1: Total number of CTE courses taken, 2013-2014 cohort
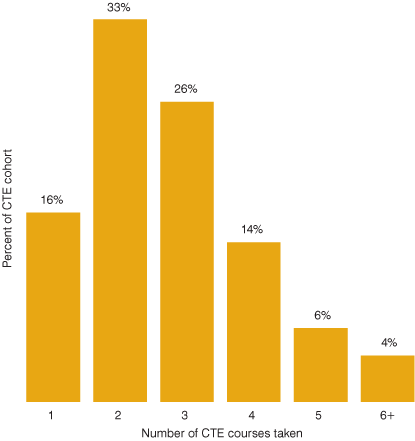
Source: Indiana Department of Workforce Development
As noted above, definitions and data used in this analysis are not the same as those used in other reports1,2 on CTE in Indiana, so results are often not directly comparable.
To determine employment outcomes, the CTE participants were matched to wage records from unemployment insurance filings. They were also matched to data from the Commission for Higher Education (CHE) to determine whether they were enrolled in an Indiana public college or university during the 2015-2016 school year. In some cases, data from the U.S. Census Bureau’s Quarterly Workforce Indicators on employment of 22-to 24-year-olds in Indiana is used as a comparison group.
Long-term outcomes
Employment and wages
The 2010-2011 cohort of CTE-participating high school graduates can provide a general picture of long-term employment and wage outcomes. The number employed in each quarter grew to around 64 percent by the 22nd quarter after the cohort’s last term (see Figure 2). It is important to note that this does not count anyone who was employed outside Indiana. Immediately following the last term, 32 percent of graduates (56 percent of those employed) worked in retail trade or accommodation and food services—industry sectors that tend to include a high percentage of low-wage workers. This percentage declined to 17 percent (27 percent of workers) by the 22nd quarter.
Figure 2: Employment outcomes of CTE graduates by quarter, 2010-2011 cohort
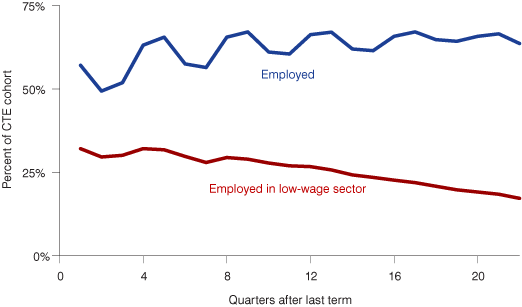
Note: Employment data are limited to those who were employed within Indiana.
Source: Indiana Department of Workforce Development
Average quarterly wages also increased for graduates who were employed, from just under $2,000 up to $6,885 in the 22nd quarter (see Figure 3). It isn’t immediately clear how much of this increase results from more hours worked and how much is due to higher wage rates, but the decline in the percentage of graduates in low-wage sectors implies that the latter probably explains a portion of the increase.
Figure 3: Average quarterly wages of CTE graduates, 2010-2011 cohort
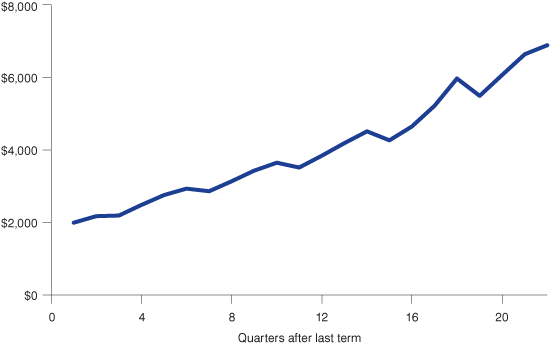
Source: Indiana Department of Workforce Development
Industry of employment
Breaking out employment by industry sector in the 22nd quarter reveals some interesting information about how employment outcomes for CTE participants compare to overall employment of young adults in Indiana (see Figure 4). A smaller share (27 percent) of CTE participants work in the two low-wage sectors compared to all 22- to 24-year-olds in Indiana (32 percent). Instead, CTE participants are more likely to work in the manufacturing or health care and social assistance sectors than other workers at similar ages.
Figure 4: Industry of CTE graduate workers, 22 quarters after last term, 2010-2011 cohort
Source: Indiana Department of Workforce Development (CTE cohort) and U.S. Census Bureau Quarterly Workforce Indicators (all workers)
Short-term outcomes (2013-2014 cohort)
Employment and wages
The 2013-2014 cohort can provide a more detailed view of how outcomes for CTE participants vary depending on the number and subject area of the courses they took. In the fourth quarter of 2016 (10 quarters after the 2013-2014 cohort’s last term), 58 percent of the cohort was employed in Indiana (see Figure 5). Graduates who took five or more CTE courses were more likely to be employed (64 percent) than CTE graduates overall.
Figure 5: Outcomes for CTE graduates 10 quarters after last term, 2013-2014 cohort
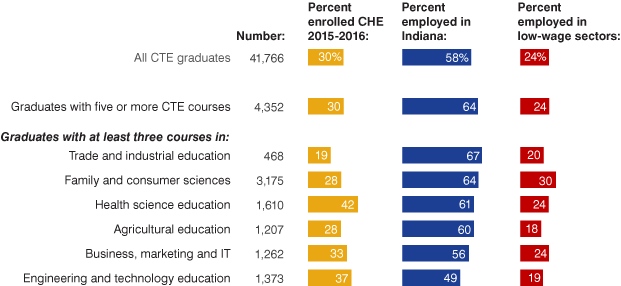
Source: Indiana Department of Workforce Development
Thirty percent of CTE participants were enrolled in an Indiana public college during the 2015-2016 school year. CHE enrollment and wage employment are not mutually exclusive, so some of these students may also be counted in the 58 percent employed. Twenty-four percent of CTE participants were employed in the retail or accommodation and food services sectors.
Looking at the subject areas that CTE participants studied can provide further insight into the relationship between CTE and employment outcomes. Students who took courses in health science or in engineering and technology education were most likely to be enrolled in public colleges in Indiana during the 2015-2016 school year (42 percent and 37 percent, respectively). Students who took at least three courses in the trade and industrial education subject area had the lowest CHE enrollment rate (19 percent), but the highest employment rate (67 percent). Students who studied family and consumer sciences also had high employment rates (64 percent), but nearly half of them worked in the low-wage retail and food and accommodation sectors.Industry of employment
Although the wage data lacks information on workers’ occupations, the industry of the employer can still provide some information on whether fields CTE students end up in are related to their CTE participation. Associating each CTE subject area with specific industry sectors or subsectors (see Table 1) enables a crude analysis of whether CTE participants are more likely to work in fields related to the CTE courses they took in high school.
Table 1: Relevant industries for each CTE program area
| CTE subject area | Relevant industries (NAICS code) |
|---|---|
| Agricultural education | Agriculture, forestry, fishing and hunting (11), food manufacturing (311) |
| Business, marketing and information technology | Information (51), finance and insurance (52), professional, scientific, and technical services (54), management of companies and enterprises (55) |
| Engineering and technology education | Manufacturing (31-33) |
| Family and consumer sciences | Elementary and secondary schools (6111), social assistance (624) |
| Health science | Ambulatory health care services (621), hospitals (622) |
| Trade and industrial education | Construction (23), manufacturing (31-33), transportation and warehousing (48-49), repair and maintenance (811) |
Source: Indiana Department of Workforce Development
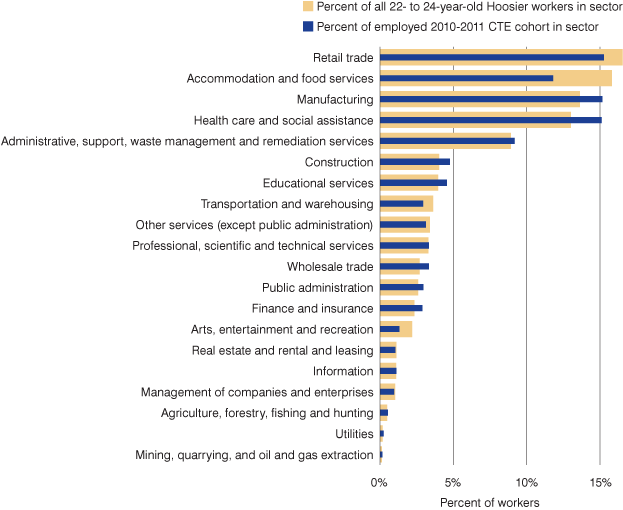
In general, it appears that employed graduates who took at least three courses in a single CTE subject area are more likely to be working in related industries when compared to the share of 22- to 24-year-old Hoosiers in those industries overall (see Figure 6).
Figure 6: Graduates tend to work in CTE subject areas they studied
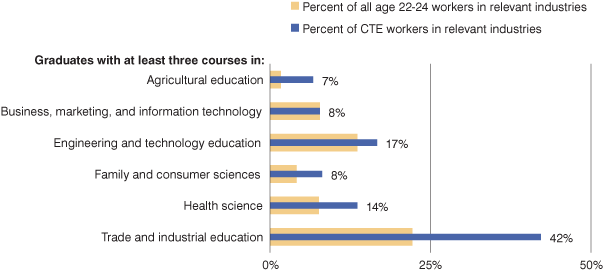
Source: Indiana Department of Workforce Development (CTE cohort) and U.S. Census Bureau Quarterly Workforce Indicators (all workers)
This is especially true in trade and industrial education, as well as health science. For example, 42 percent of CTE participants with three or more courses in trade and industrial education were employed in the construction, manufacturing, transportation and warehousing, or repair and maintenance industries. However, only 22 percent of all 22- to 24-year-old Hoosiers work in these industries.
Directions for future research
There are two major limitations on this analysis that might be remedied in future research. First, using data that includes only CTE participants limits the ability to compare outcomes for CTE-participating graduates to similar high school graduates who did not participate in CTE. One potential solution to this problem is to use student data matched to wage records for all high school graduates to form a better comparison group.
Another limitation on this analysis is that the lack of data on occupation of employed graduates makes it difficult to determine with confidence whether CTE participants are employed in fields where their CTE education is relevant. The Indiana Department of Workforce Development is currently partnering with the Indiana Business Research Center with the goal of assigning occupational classifications to the department’s wage records.3 The outcome of this project might result in better opportunities to evaluate how employment outcomes for CTE participants relate to the subject areas and pathways they choose in school.
Notes
- Fleck Education, “2016 Indiana Career Readiness Report,” www.in.gov/che/cte/files/17-state-cte-career-readiness-report-final-3-3-17.pdf.
- Center for Education and Career Innovation, “CTE ROI Study Update,” October 28, 2014, www.in.gov/icc/files/Sector_Strategies_Taskforce_-_CTE_ROI_10-28-14_Final.pdf.
- Thea Evans and Carol O. Rogers, "Occupation Assignment Engine Helps Fill Knowledge Gaps," InContext, July 2017, www.incontext.indiana.edu/2017/july-aug/article2.asp.