The Home/Work Balance: Visualizing Commuting in Indiana
Just about everyone is familiar with the balancing act—location of home and location of work usually means commuting. Either the location of our home determines the work available near to us, or the place of work affects where we live. This article takes a close look at commuting within, to and from Indiana to see how Hoosiers balance their work and home locations.
Figure 1 interactively displays the locations of home and work for people who reside or work in Indiana. Each line represents 20 individual commuters, with Indiana residents shown in yellow and residents of adjacent states that work in Indiana shown in blue.
Figure 1: Commuter Origins and Destinations
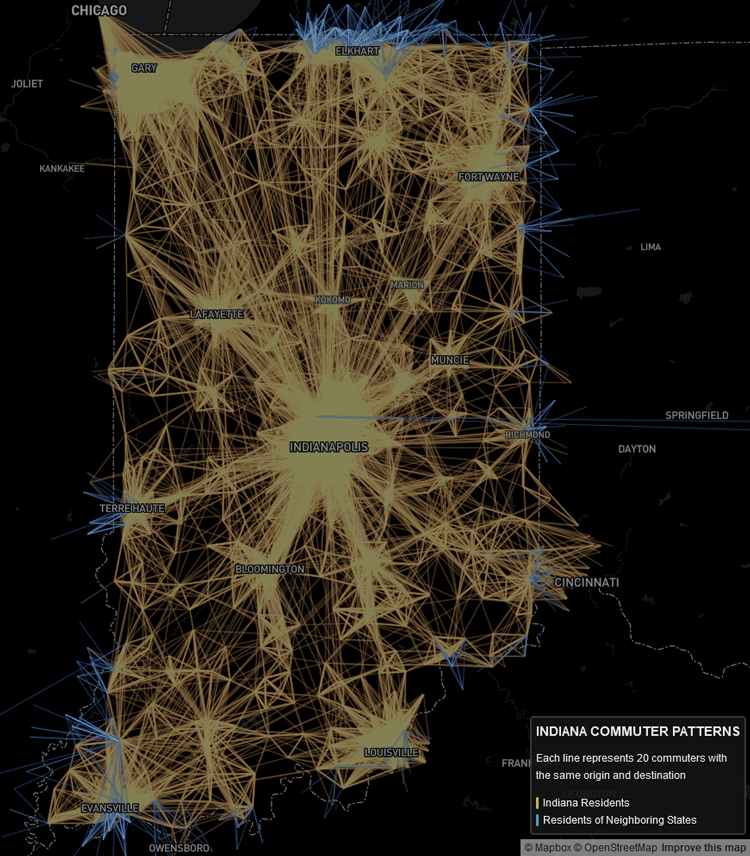
Note: Interactive version no longer available.
Source: IBRC, using 2013 LEHD Origin-Destination Employment Statistics (LODES) data from the U.S. Census Bureau, http://lehd.ces.census.gov/data/
Indianapolis, the capital and largest city in Indiana, is the hub of commuting in the state. However, the map and Table 1 show there are significant numbers of people who cross state lines to go to work. Many Indiana residents work in Chicago and Louisville, while South Bend and Evansville attract out-of-state residents for work.
Table 1: Commuters Crossing State Lines
| Where Indiana Residents Work | ||
|---|---|---|
| State | Employees | Percent |
| Indiana | 2,678,041 | 93.4% |
| Illinois | 85,790 | 3.0% |
| Kentucky | 60,209 | 2.1% |
| Ohio | 30,534 | 1.1% |
| Michigan | 12,823 | 0.4% |
| Where Indiana Workers Live | ||
| State | Employees | Percent |
| Indiana | 2,678,041 | 93.4% |
| Illinois | 53,128 | 1.9% |
| Michigan | 35,971 | 1.3% |
| Kentucky | 35,195 | 1.2% |
| Ohio | 24,455 | 0.9% |
Source: IBRC, using 2013 LEHD Origin-Destination Employment Statistics (LODES) data from the U.S. Census Bureau, http://lehd.ces.census.gov/data/
To fully understand commuting, time must be measured in addition to distance. The average Indiana commute in 2014 was 22 minutes one way, which equates to almost eight days spent commuting each year.1 The full breakdown of commuting times for employed Indiana residents in 2014 is shown in Figure 2.
Figure 2: Estimated Number of Employed Indiana Residents by Commute Time
Source: IBRC, using 2014 IPUMS-USA data from the University of Minnesota, www.ipums.org
Understanding commuting is important for individuals, employers and the government in order to mitigate the negative impacts of commuting and plan better for future infrastructure needs. As technology advances, generational shifts in the workforce occur2 and telecommuting increases,3 the landscape of commuting will continue to evolve.
Notes
- Source: IBRC, using IPUMS-USA data from the University of Minnesota, www.ipums.org
- Carol O. Rogers, “Millennials Outnumber Boomers,” InContext, January-February 2016, www.incontext.indiana.edu/2016/jan-feb/article2.asp.
- U.S. Census Bureau, “Working at Home is on the Rise,” www.census.gov/library/visualizations/2013/comm/home_based_workers.html.