Yardsticks: Per Capita Income as One Measure of Economic Well-Being
A research project from the Center of Excellence in Workforce Education Research
As a society, we are enamored of numbers. When we were children, our parents may have used a yardstick to measure our height to help us visualize and track our physical growth. As adults, we use other kinds of yardsticks to measure our personal status and economic well-being: our household income, the price of the new car or the house, whether we can afford our groceries or health care.
Yardsticks are also used to measure our collective well-being, and one of these is per capita (or per person) personal income (PCPI) at the national, state and local level. This measure sums all of the available income streams (wages, farm incomes, proprietors’ income, rents, dividends, interest, retirement pensions, government medical payments, Social Security payments, etc.) paid to residents of the geography in question. It is a simple, comparative construct: Divide the total income by the population of an area to arrive at an estimate of income per person. The U.S. Bureau of Economic Analysis produces an estimate of per capita income for states each quarter, as well as an annual figure.
Since 2013, a second set of estimates has been produced that attempts to adjust for differences in the cost of goods and services across areas, as well as the effects of inflation over a five-year span, with a goal of leveling the statistical playing field among states with higher or lower costs of living. This results in more realistic comparisons. This second set of estimates is referred to as the “real” per capita personal income since it is adjusted for price parity. While the underlying trend of the data is unchanged, the levels of the two series may vary significantly.
Examination of the most recent annual release of nominal, unadjusted per capita income reveals a familiar pattern, with Indiana incomes trailing those of the nation as a whole (see Figure 1).
Figure 1: Nominal (Not Adjusted) Per Capita Personal Income, Indiana and the U.S.
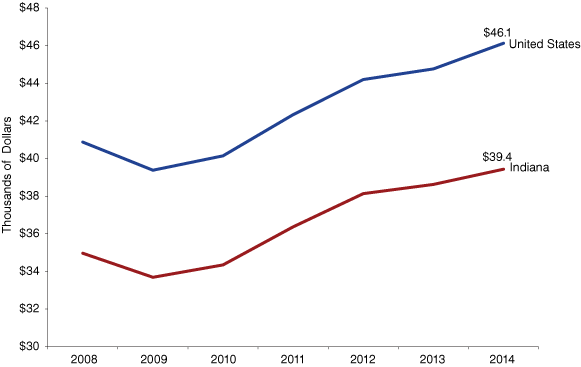
Source: U.S. Bureau of Economic Analysis
Indiana’s 2014 PCPI is $6,700 (14.5 percent) below the national level of $46,100. Neighboring states, with the exception of Illinois, also have 2014 PCPI values below the national level, with gaps ranging from 8.4 percent to 18.4 percent compared to the national estimate (see Figure 2).
Figure 2: Income Gap (%) Compared to U.S., Nominal Per Capita Personal Income
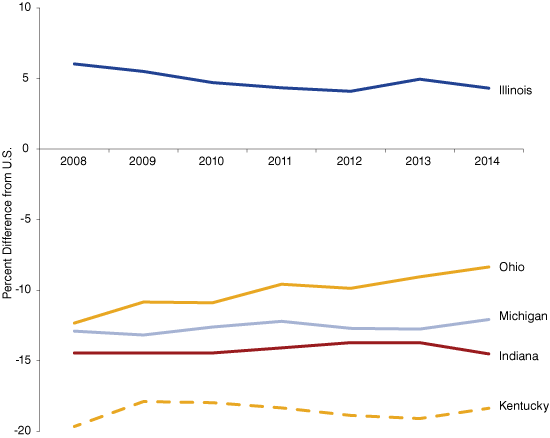
Source: U.S. Bureau of Economic Analysis
The real PCPI estimates are more encouraging, with the gap from U.S. levels narrowing to $2,300 (or 5.5 percent) for Indiana and Ohio’s PCPI moving above the U.S. level by 2.5 percent in 2013 (see Figure 3). The adjusted series is lagged by about 16 months compared to the unadjusted series and has a five-year reach back.
Figure 3: Real Per Capita Personal Income for Selected States’ Gap Compared to U.S.
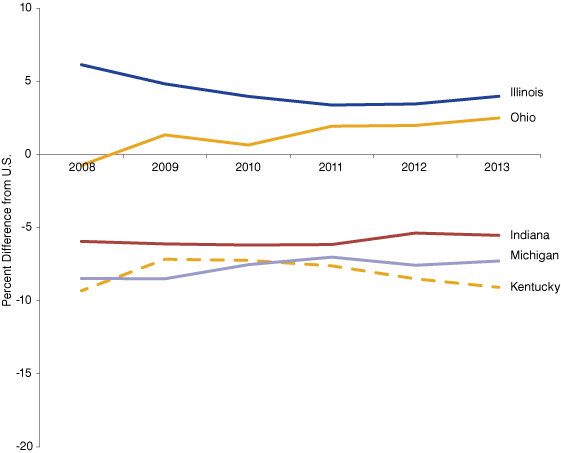
Source: U.S. Bureau of Economic Analysis
Year-over-year change in real per capita income for Indiana briefly exceeded that for the U.S. in 2012, as higher population growth for the nation and slightly stronger wage and salary employment growth in the state produced a 3.4 percent gain for that year compared to 2.5 percent for the U.S. (see Figure 4).
Figure 4: Percent Change in Real Per Capita Personal Income
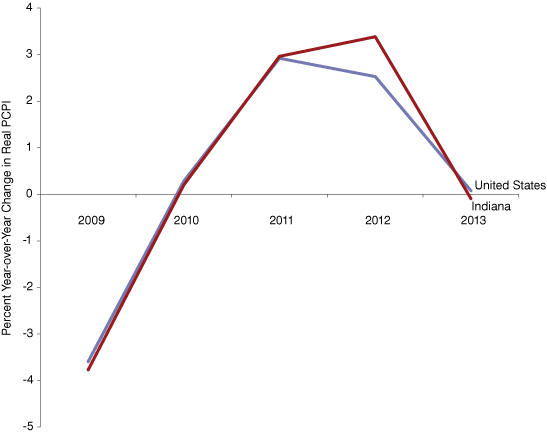
Source: U.S. Bureau of Economic Analysis
A variety of factors influence per capita income, including labor force participation (i.e., the percentage of the population 16 years and older working or actively seeking work), population change and age composition, the unemployment rate, job growth or contraction, and industry makeup. Some of these factors have greater persistence than others or greater relevance in generating change or differences in the PCPI across geographies. Few of them can be adjusted out or smoothed in the same manner as cost of living or inflation, as they are embedded in the economic and demographic structure of each state or locality. Per capita personal income is a valuable yardstick, and the real or chained PCPI is a significant improvement; however, differences across states and with the national average are unlikely to disappear.
We will continue to monitor and analyze these new data and report back on the findings. In the meantime, the full data set can be viewed at the U.S. Bureau of Economic Analysis website’s Regional Data section.
References
- U.S. Bureau of Economic Analysis, “Real Personal Income for States and Metropolitan Areas, 2013,” July 1, 2015, www.bea.gov/newsreleases/regional/rpp/rpp_newsrelease.htm.
- U.S. Bureau of Economic Analysis, “State Personal Income, 2014,” March 25, 2015, www.bea.gov/newsreleases/regional/spi/2015/spi0315.htm.
- Carol O. Rogers, “Measuring Income Refined: Per Capita Personal Income Now Adjusted for Regional Price Parities,” InContext, May-June 2014, www.incontext.indiana.edu/2014/may-jun/article1.asp.