Indiana Housing: A Historical Perspective
The second edition of the Indiana Business Review—published on April 15, 1926, by the Indiana Business Research Center (known as the Bureau of Business Research in those days)—opened with these words:
The building boom, based on speculation and easy money, which has been much talked about as a national problem, does not now exist and never has existed so far as Indiana building is concerned.
The so-called boom has been confined to Florida, New York City, and a half dozen other cities. Consequently, national predictions tend to be seriously misleading if applied to building in Indiana.
Replace the words “building” with “house prices,” and “New York City” with “Las Vegas,” and this quote would be just as true if it were written about the housing market in 2006.
While the bubble periods of the 1920s and the 2000s may not be a perfect analogy, the warning in the above quote against allowing national headlines to color our thinking on Indiana trends holds true today. This advice was never more apt than during the most recent housing bubble era, when house prices at the national level lost touch with reality before eventually tumbling back to earth. During this boom and bust period, however, Indiana’s house prices remained tied to changes in the state’s household incomes (see Figure 1). Unfortunately, while Indiana didn’t add fuel to the problem, the state did share in the consequences during the Great Recession.
Figure 1: Ratio of Median Home Sales Price to Median Household Income
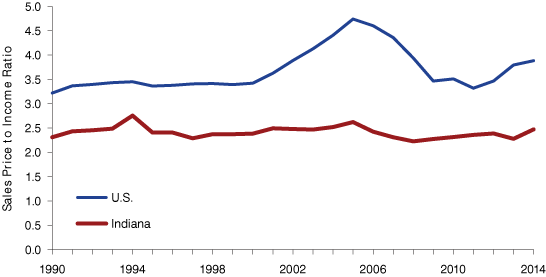
Source: U.S. Census Bureau, Moody’s Economy.com, Indiana Association of Realtors and National Association of Realtors
Indiana’s housing market differs from the U.S. in other ways, too. The state’s homeownership rate is well above the national average, for instance, and Hoosiers enjoy some of the most affordable housing in the country.
To commemorate the Indiana Business Research Center’s 90th anniversary, this article will take a long look back at changes in Indiana’s housing market. Not all of the data series presented in this piece extend back to the 1920s, but we will cover as much ground as possible to highlight the key shifts in Indiana housing over the last 75 years or more.
Household Formation Ups and Downs
The number of households in Indiana has increased more than threefold over the last 95 years, from nearly 721,600 in 1920 to more than 2.5 million in 2014. Indiana experienced strong increases in the post-World War II years, averaging 216,000 new households per decade between 1940 and 1970. Household growth really spiked in the 1970s, adding nearly 317,600 households, as the baby-boom generation began to come of age and women entered the labor force in larger numbers. Indiana’s household formation trend has been on a bit of a roller coaster ride since the 1970s, however (see Figure 2).
Figure 2: Household Formation Trends
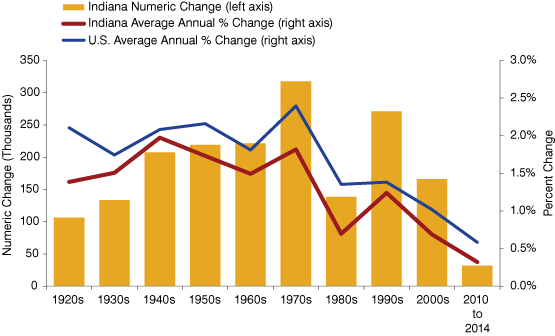
Source: U.S. Census Bureau, Decennial Census and American Community Survey
In terms of the rate of growth, the 1940s set the fastest pace of household gains in Indiana by climbing at a rate of 2 percent per year over the decade. The average annual marks set during the 1950s and 1970s were just a shade lower at 1.7 percent and 1.8 percent, respectively.
After a return to strong growth during the 1990s, Indiana’s household formation rate has slowed over the last 15 years. The number of households in the state grew at a rate of nearly 0.7 percent a year during the 2000s—the lowest mark for any decade in the last 90 years. Indiana’s pace has slowed even further so far in this decade, with a household formation rate of just 0.3 percent a year between 2010 and 2014.
Much of this recent slowdown can be pinned on the Great Recession, as migration into Indiana has declined sharply since 2007 and household formation rates among younger adults are well below pre-recession levels. These younger adults now on the sidelines, though, do represent a pool of pent-up housing demand that could enter the market as their job prospects improve. A stronger labor market could also attract more residents to the state, so there is a good chance that the state’s household formation rate will pick up in the second half of this decade if the economy continues to improve.
Shifts in Household Composition
In addition to strong population growth, another reason why the number of Indiana households increased so dramatically through much of the 20th century is that the very nature of households changed over that time. Perhaps the best example of the shifts in household composition is the explosion in the number of people living alone.
In 1940, roughly 72,300 Indiana residents lived alone, which translated to nearly 8 percent of all households in the state. This number jumped by a factor of nearly six by 1980 when there were 413,000 Hoosiers living alone—or more than 21 percent of all households. This share has continued to climb since, although not quite as dramatically. As of 2014, more than one-quarter of all households in Indiana had one occupant (see Figure 3).
Figure 3: Indiana's Shifts in Household Composition
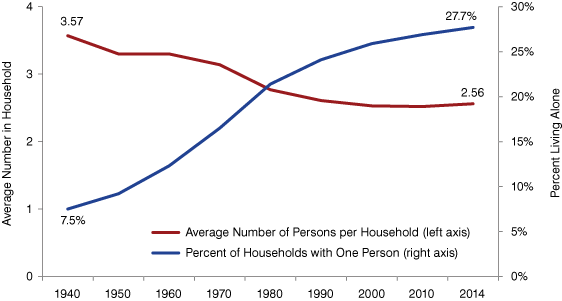
Source: U.S. Census Bureau, Decennial Census and American Community Survey
Several factors have contributed to this shift, including increased economic security for the elderly, longer life expectancies and improved health in old age, a higher rate of divorce, better economic prospects for young adults and the trend toward young adults marrying later in life.1 The share of solo households should continue to inch up as baby boomers age.
This increased likelihood of living alone, along with lower fertility rates after the baby boom, has led to a decline in the average size of Hoosier households. In 1940, Indiana averaged nearly 3.6 residents per household, but this measure has declined to roughly 2.6 by 2014.
It is interesting to note that this entire decline occurred by the year 2000, and that Indiana’s average household size has held fairly constant since then. This newfound stability may simply be a side effect of the Great Recession, with the poor economy forcing an increase in multi-generational households.2 Only time will tell whether this measure will continue to hold steady or if an improving economy will cause it to begin to fall again.
Changes in the Types of Housing Units
Not surprisingly, the rise in people living alone has led to a greater demand for apartment units. Structures with five or more units accounted for only 4 percent of the total in 1940, but this share has climbed to nearly 13 percent in 2014. As a result, the proportion of single-family units has declined some over this period, but it remains the dominant housing type in Indiana (see Figure 4). As a point of comparison, single-family units accounted for 67 percent of the total nationally in 2014, while apartment structures with five or more units represented nearly 18 percent of all dwellings.
Figure 4: Indiana Housing Units by Type
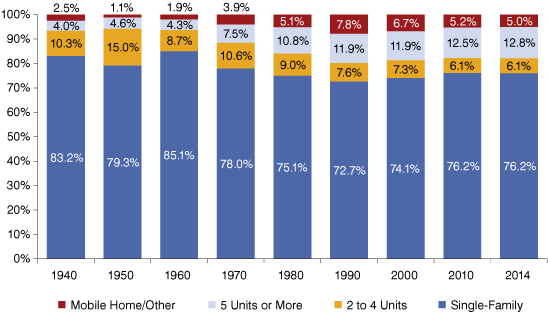
Source: U.S. Census Bureau, Decennial Census and American Community Survey
Homeownership Becomes the Norm
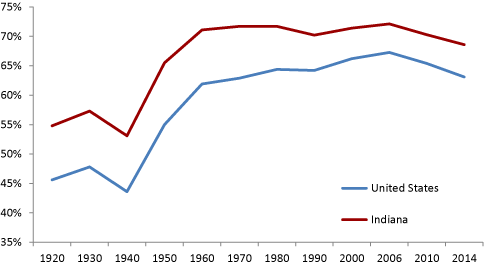
Indiana’s homeownership rate was on the rise in the 1920s, but the Great Depression reversed these gains and drove the state’s rate down to 53 percent by 1940. Following World War II, however, homeownership began to take off in a big way, with the rate rising to 71 percent by 1960 (see Figure 5).
Indiana’s homeownership rate had stayed above the 70 percent mark until the housing bust and Great Recession hit in the late 2000s. Indiana’s rate peaked at 72.1 percent in 2006, but has since dropped to 68.6 percent in 2014. This decline was driven in large part by a sharp spike in foreclosures beginning in 2006, but the state’s foreclosure rate has dropped just as dramatically since late 2011 and now sits at its lowest point in the last 14 years.3 This development offers some hope that Indiana’s homeownership rate will begin to stabilize.
The homeownership rate for the U.S. has followed a similar pattern, although Hoosiers have always been more likely to own their homes. The U.S. homeownership rate peaked at 67.3 percent in 2006, but has slid to 63.1 percent in 2014. Indiana’s homeownership rate ranked 11th-highest among states in 2014.
Figure 5: Homeownership Rates in Indiana and the U.S.
Source: U.S. Census Bureau, Decennial Census and American Community Survey
Indiana Housing Costs Rise Slower than the Nation
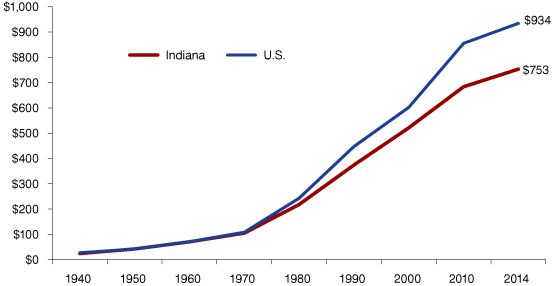
Through the middle part of the 20th century, both monthly rents and home values in Indiana were similar to the national average. Beginning in the 1970s, however, housing costs around the country started to climb much faster than in Indiana. Median monthly rents for Indiana and the U.S., for instance, were identical in 1950 at $42 a month. Rents at the national level were 11 percent higher than in Indiana by 1980, and were 21 percent higher in 2014 (see Figure 6).
Figure 6: Median Monthly Rents in Indiana and the U.S.
Source: U.S. Census Bureau, Decennial Census and American Community Survey
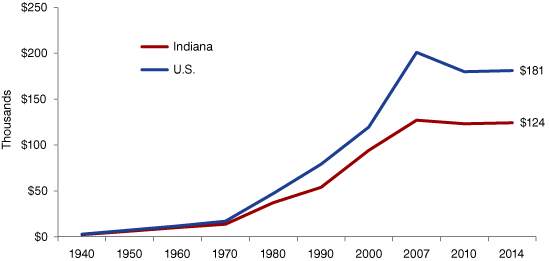
The pattern has been similar with regard to owner-occupied homes. The U.S. median home value was about 17 percent higher than the Indiana mark of $6,226 in 1950, but the difference between the two has jumped to more than 37 percent in 2014 (see Figure 7).
Figure 7: Median Home Values in Indiana and the U.S.
Source: U.S. Census Bureau, Decennial Census and American Community Survey
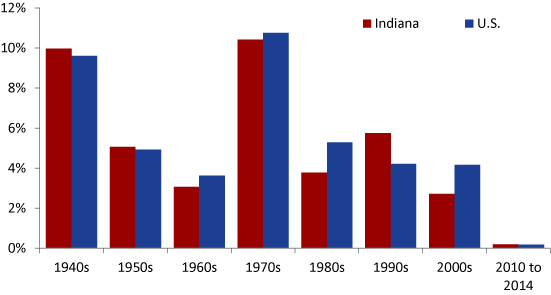
There is good news and bad news for Hoosiers in this widening gap. On the negative side, one reason that Indiana’s home values have grown more slowly is that the state’s incomes have lagged the nation for most of the last 50 years. One notable exception was during the 1990s when growth in Indiana’s median household income outpaced the nation, and the state’s home values increased at a greater rate, as well (see Figure 8).
Figure 8: Average Annual Increase in Median Home Value by Decade
Source: U.S. Census Bureau, Decennial Census and American Community Survey
On the positive side, as the ratios of median sales prices to median household income in Figure 1 show, housing is more affordable in Indiana than in most other parts of the country. According to Moody’s Economy.com, in fact, Indiana enjoyed the nation’s third-best housing affordability conditions in 2013, ranking behind only Michigan and Ohio.4
Conclusion
Since the Indiana Business Research Center set up shop in 1925, both the state and the U.S. have seen dramatic shifts in its housing markets. Although there are certainly differences between Indiana and the nation in many housing-related measures, the general trend lines of these measures tended to follow similar contours over the past 90 years.
In one important way, though, Indiana’s housing market has been far different from the U.S., especially in the last 15 years. Just as Indiana wasn’t part of the real estate “building bubble” of the 1920s, the state avoided the price bubble of the 2000s. Had Indiana’s house prices followed national trends, even more Hoosiers would have been at risk of foreclosure in recent years. Instead, housing indicators in Indiana typically follow the economic and demographic fundamentals in local markets—both in good times and bad. The same can’t always be said for the nation.
Notes
- Rosa Kreider and Jonathan Vespa, “The Historic Rise of One-Person Households: 1850-2010,” SEHSD Working Paper No. 2014-19, April 2014, www.census.gov/library/working-papers/2014/demo/kreider-01.html
- Richard Fry and Jeffrey Passel, “In Post-Recession Era, Young Adults Drive Continuing Rise in Multi-Generational Living,” Pew Research Center, July 2014, www.pewsocialtrends.org/2014/07/17/in-post-recession-era-young-adults-drive-continuing-rise-in-multi-generational-living/.
- Matt Kinghorn and Zoe Caplan, “Indiana Reaches Important Housing Milestones in 2015,” InContext, September-October 2015, www.incontext.indiana.edu/2015/sept-oct/article1.asp.
- Matt Kinghorn, “Indiana’s Housing Market in 2014: Moving toward Stability,” December 2014, www.ibrc.indiana.edu/studies/2014HousingReport.pdf.