The Rearview Mirror: A 90-Year Retrospective on Indiana's Economy
Ninety years ago, in 1925, the Indiana Business Research Center (IBRC) was born as the Bureau of Business Research in Indiana University’s School of Commerce and Finance (predecessor to today’s Kelley School of Business). Reflecting on this milestone leads one to wonder how different Indiana’s economic and business climate is now vs. then.
Unfortunately, many of the key data series used to track employment, economic output, etc., either don’t go back that far or they’ve changed how indicators are defined or measured, impeding direct comparisons over such a long period. Fortunately, in its very first year, the new Bureau had the insight to launch a periodical, the Indiana Business Review (IBR), to inform the state’s business and government leaders about economic conditions and trends.1
Leafing through the pages of the early IBR reveals that much has changed, yet much remains quite similar despite the decades that have transpired. We’d thus like to share a few observations with the reader to reflect on these comparisons and contrasts, drawing from Volumes 1-5 of the IBR, which provided monthly perspective on Indiana’s economy from March 1926 through December 1930.
The Roaring Twenties
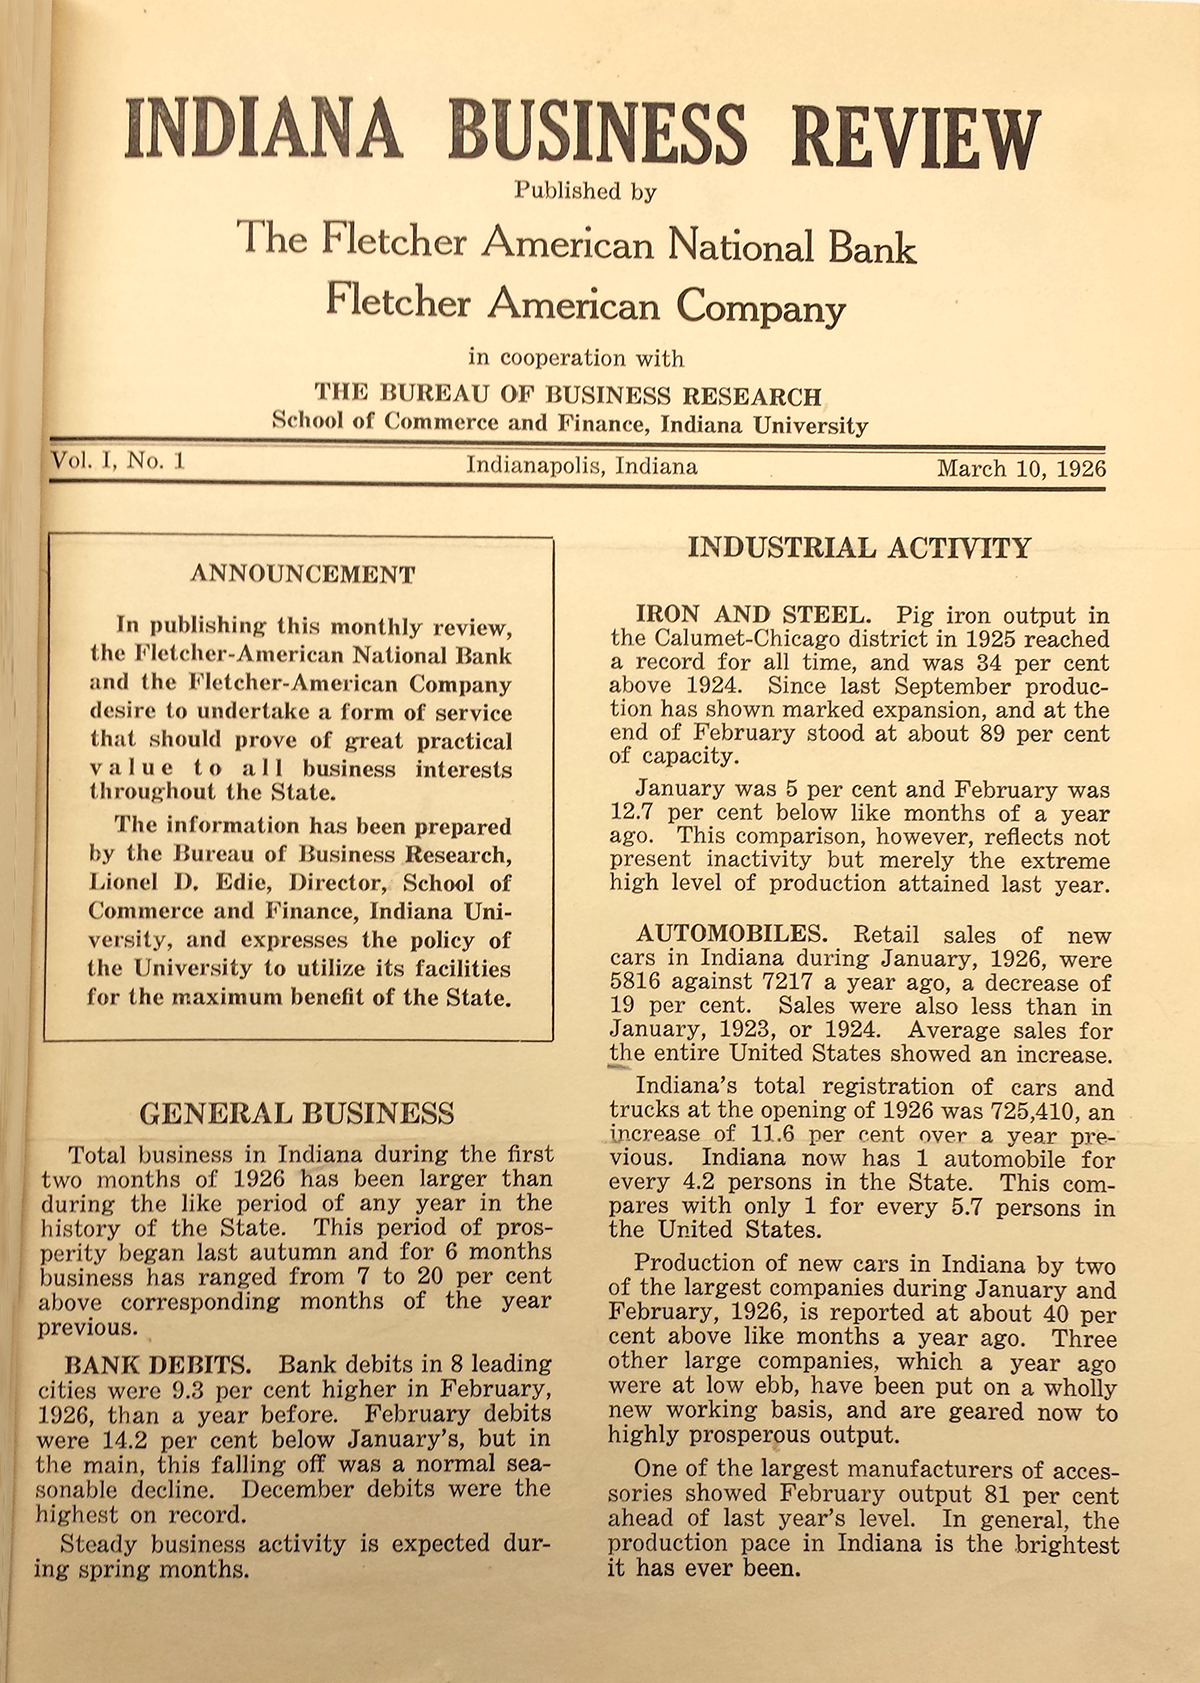
The IBRC and the Indiana Business Review were born at a time of great economic vitality. The opening paragraph from the first IBR issue states,
“Total business in Indiana during the first two months of 1926 has been larger than during the like period of any year in the history of the State. This period of prosperity began last autumn and for 6 months business has ranged from 7 to 20 per cent above corresponding months of the year previous.”
The mid-1920s were indeed times of economic enthusiasm. The first IBR issue chronicled impressive gains (that often set records) in Indiana banking activity, industrial production, electricity generation, building-stone production and employment. Construction was strong, too, with half of all new construction dedicated to building homes to accommodate Indiana’s growing population. Other indicators showing robust performance at the time included retail sales, freight car loadings and bank deposits.
The inaugural issue also summarized local conditions in the state’s key cities. In Indianapolis, for example, auto production and manufacturing generally were upbeat and building permits were up 24 percent year-over-year. Blast furnaces in Gary were running at close to 100 percent of capacity. Building was up in South Bend, and auto production was 40 percent ahead of the previous year. Most Terre Haute factories were running full-time, though more than a third of the region’s coal miners were out of work due to “labor union trouble,” mild weather and price competition.
Thus, despite occasional bumps here and there, much of the Indiana economy showed substantial upward momentum in 1926. This reflects the national economic picture of growing cities, significant industrial expansion, and broader participation by the public in financial markets as investors borrowed at low rates to buy stocks, hoping to cash in on rising share values. In the spirit of the times, economist Irving Fisher proclaimed that “stock prices have reached what looks like a permanently high plateau.”
From Boom to Bust
Of course, what goes up must come down, as the U.S. and global economies did in the late-1920s. The stock market crash of October 1929 hammered the point home, leading to the collapse not only of the fortunes of major investors, but also of ordinary Americans and Hoosiers. Unemployment shot up and remained high for many years as the Great Depression slogged along.
It was just a year earlier that the IBR introduced a new multi-factor index of economic activity to track the Hoosier economy. The Indiana General Business (IGB) Curve graphed a weighted average of nine metrics tracked by the Bureau: automobile, coal, stone, electric power and pig iron production; building construction; bank debits; and hog and cattle receipts. These were all seasonally adjusted and weighted according to their importance to the Indiana economy, and then integrated into a composite index.
As shown in Figure 1, the IGB Curve depicts the percentage by which a given month’s activity was above or below the typical value for that month. A zero (“N”) value means business activity was normal, while positive values indicate activity above the normal level and conversely for negative values.
Figure 1: Indiana Economic Conditions, 1920 to 1930
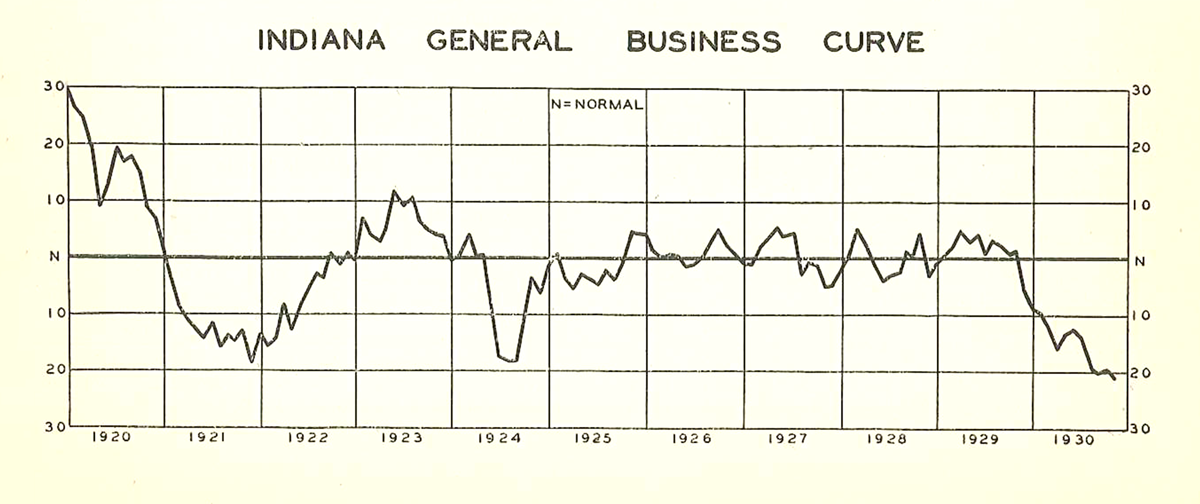
Source: Indiana Business Review, Vol. V, no. 11, November 20, 1930
From late 1925 through most of 1929, Indiana economic conditions hovered within about ±5 percent of the normal range, with above-average results more common than below-average. But the last quarter of 1929 began a precipitous plunge to more than 20 percent below normal in late 1930. The December 1930 IBR reported that retail customers were making as many purchases as a year earlier, but in smaller quantities. “Freight car loadings at Indianapolis during November were far under any month in recent years,” as were new car registrations and used car sales. Gasoline sales, however, were up year over year.
Not surprisingly, automobile manufacturers were operating on reduced schedules. Limestone shipments for building reached their lowest point in years, and steel mills were running at 45 percent of capacity. Building permits were down 55 percent from a year earlier, and 61 percent from 1928.
Given such weak conditions, it’s not surprising that fewer workers were quitting their jobs (generally less than 1 percent across sectors), though November 1930 layoffs rose greatly in certain industries—reaching 17 percent in metals-and-metal-products and 32 percent in vehicles—while remaining in the low single-digit percentages in most others.
Then and Now
This brief trip back through history offers a contrast between Indiana’s experience during the harsh economic conditions of the early Great Depression years and how we fared in the Great Recession of 2007-2009. The recent recession was significantly less drastic, prolonged and widespread than the depression of the 1920s and 1930s. Indiana felt the Great Depression’s blow across many industries, whereas the current decade’s recession hit our manufacturing sector substantially harder than other industries (though most sectors experienced job losses).
And though Hoosiers’ recovery from the Great Recession was extended over several years, the state’s economy actually shrank for less than two years. Indiana employment has returned to near-record-high levels in recent months, unemployment is down to levels last seen in 2008, and our state’s total economic output is higher than ever.
As Indiana leaders seek to build on this momentum to reach even greater heights, they may find it helpful to review how the Hoosier economy has performed in the past.