Ninety Years of Agriculture: Going Beyond the Rockwell Image of Farming
To commemorate the Indiana Business Research Center’s 90th anniversary, InContext has featured several articles that look back to see how the state of Indiana has changed over the last nine decades. In this issue, we will compare and contrast Indiana’s agriculture industry in 1925 versus the industry today.
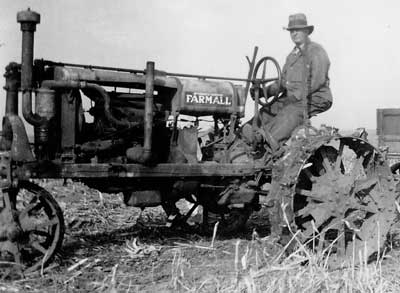
Photo courtesy of Sherry Thurner from her blog Late B(l)oomer - Sherry Thurner
The 1920s and Tractors
In the urban areas of Indiana, lots of changes were occurring during the 1920s, with rapid advances and growth in banking, industrial manufacturing, construction and electricity.1 The rural areas of the state were also experiencing change and new inventions, but to a different degree.
Indiana in 1925 was heavily dependent on production agriculture, with 86.3 percent of the state’s acres in farmland and 25.9 percent of the state’s population residing on the 195,786 farms throughout the state. Farming was hard work with a great deal of manual labor that included the entire family.
Industrialization of the production agriculture process and its output was just beginning. In the early to mid-1920s, farmers were still riding the prosperity wave that resulted from the wartime food demand during World War I.
Tractor ownership was still in its infancy, with only 12 percent of Indiana farmers reporting tractor usage in 1925. Tractors and related machinery ownership picked up steam after 1924 with the invention of a general-purpose tractor (McCormick Deering Farmall). Farmers were able to reduce their reliance on horses and greatly improve production efficiencies. Consequently, fewer acres went into horse food production and instead into cash crops (crops sold at market). Drawbacks to utilizing tractors and corresponding machinery did exist, but farming was done at greater speed on a scale deemed impossible in prior years.
The latter half of the 1920s saw agricultural market prices drop, forcing farmers to scrutinize their finances and farming plans. For a farmer to justify the purchase of machinery, and in order to pay the high up-front cost, they needed to produce much more—often necessitating the purchase of additional ground. Therefore, larger farms (about 50 acres) were more likely to invest in machinery compared to smaller farms. Many small farms that purchased tractors but did not increase their production lost their farms in the ensuing Great Depression.2
In many ways, this similar dilemma exists today. Larger operations are often in a position to purchase newer technologies, as well as land, in an effort to maximize efficiencies.
Agriculture Today
Today, the agriculture industry is much more diverse and technologically advanced than it was 90 years ago. Diversity is readily apparent when comparing the two Census of Agriculture results. The 2012 version encompasses a much larger scope of operations in regards to crops grown and livestock raised in addition to production practices.
At the local level, we have seen a shift from where most farmers (and their families) live and work on the farm full-time to an increased number of off-farm jobs held by the principal operators, as well as their spouses. The amount of necessary capital to start and maintain a farming operation is staggering in light of producing a homogenous commodity. While a farmer does receive a degree of protection when disaster strikes, it is still a risky business with many factors out of the farmer’s control.
One thing that has not changed is the amount of sweat equity farmers invest in their farm. Over the past 90 years, it has remained hard work—physically and mentally. That hard work is aided now that the farming operation itself can be technologically advanced. Today, farm implements are able to respond to an individual farmland section’s needs as a result of soil grid mapping, soil type, past production output and applications of fertilizer, lime or other nutrients. Seed genetics have advanced to better withstand drought conditions, pests and diseases all while improving yields.
Technological advances have also been applied to livestock operations. Advances range from genetics, complex feed rations with numerous types of nutrients infused to maximize growing efficiencies, breeding practices, as well as scientific research on best growing practices.
Families still operate 87 percent of all farms—yet the average farm size has grown 147 percent (151 acres) since 1925. The most startling difference between then and now? The number of farms in Indiana has dropped 70 percent since 1925, but farmland acreage has only seen a 26 percent drop. It is easy to see there has been a considerable amount of farm consolidation over the years. Interestingly, in the past 20 years, a resurgence of smaller farming operations has occurred, with many growing products to fit a market niche among consumers. Figure 1 shows the change in farm size distribution between the two points of interest (2012 Census of Agriculture data was the most recent available).
Figure 1: Indiana Farms by Size
Source: USDA Census of Agriculture, 1925 and 2012
As the quantity of farms has decreased, so has the number of individuals who have direct experience with production agriculture. In recent years, the agriculture industry has focused on educating consumers on how large-scale agriculture production works. In the past, a greater share of the population farmed and had a more intimate understanding about their food supply and the process it took to arrive at their tables.
Today, most farms produce a few commodities and either take all, or a large share, of their output to the market. This is an important shift away from subsistence farming as it shows how much manufacturing and wholesale operations play a part in adding value to the raw outputs from the farm.3
Consumers generally have limited knowledge about their food’s origin and the journey it took to the grocery store. Currently, we are experiencing a resurgence of interest in local foods, with consumers yearning to understand food, production practices and have a relationship with the farmer. The local foods movement has extended beyond farmers markets, as restaurants source foods locally, institutions prefer purchasing local foods, and consumers become more engaged via farm tours, community-supported agriculture memberships and support of local foods initiatives.
Ag Change by the Numbers
The previous two sections attempted to explain the agricultural environment at the respective time frames. This final section will quantify the changes over the past nine decades for a select number of categories.
Table 1 shows the values for 1925 and 2014 (in some cases, 2012 data was the most recent available), as well as the change over time. The quantity of farmland, farms and acres have been declining. On the flip side, the total value of products sold has increased dramatically (so have expenses). It must be iterated that in 1925, a sizeable amount of the production at the farm level was also used to feed the family and farm animals. Today, the market opportunities (and demand) for agricultural goods span across the globe.
Farmland distribution shows Indiana’s farmland has remained in cropland, at an increase of 42 percent over the past 90 years, at the expense of pastureland and other farmland ground. The share of Indiana’s farmland in woodland has also increased. Historically, farmers have owned a hefty share of the state’s woodland acres, and our state woodland has been very successful at regenerating itself over the years.
Table 1: Indiana Agriculture Statistics
| Metric | 1925 | 2014 | Difference |
|---|---|---|---|
| Acres in farmland | 19,915,120 | 14,700,000 | -26.2% |
| Number of farms | 195,786 | 58,200 | -70.3% |
| Number of farmers** | 628,855 | 87,959* | -86.0% |
| Average farm size (acres) | 102 | 253 | 148.8% |
| Total value of products sold | $224,535,957 | $11,210,818,000* | 4,892.9% |
| Average net cash farm income | n/a | $52,861* | n/a |
| Average total farm production expenses | $23,141,229 | $155,330,000* | 571.2% |
| Farmland Distribution | |||
| Share of farmland in cropland | 60.2 | 85.5* | 42.0% |
| Share of farmland in pasture | 28.7 | 3.7* | -87.1% |
| Share of farmland in woodland | 4.2 | 7.1* | 69.0% |
| Share of farmland in other use | 6.9 | 3.6* | -47.8% |
| Productivity (bushels/acre) | |||
| Corn for grain | 22.9 | 188 | 721.1% |
| Wheat | 16.5 | 76 | 361.9% |
| Oats | 36.3 | 74 | 103.7% |
| Soybeans | n/a | 56 | n/a |
| Inventory of Livestock Production | |||
| Chickens*** | 17,355,369 | 39,392,705* | 127.0% |
| Hogs and pigs | 2,939,074 | 3,600,000 | 22.5% |
| Cattle | 1,281,810 | 870,000 | -32.1% |
| Horses | 556,078 | 97,383* | -82.5% |
| Sheep | 595,461 | 50,000* | -91.6% |
| Goats | 3,995 | 42,500 | 963.8% |
| Milk produced per cow (gallons) | 412 | 2,542 | 517.1% |
* 2012 data are shown because they are the most recent available.
** 1925 data reflects population older than 10 years on the farm; 2012 data reports for up to three operators per farm.
*** 2012 data reflects layers, pullets and broilers; no detail provided for 1925 data.
Note: 1925 agricultural values were adjusted for inflation to reflect 2012 values.
Source: Purdue Extension, using USDA Census of Agriculture and National Agricultural Statistics Service data
Row crop production efficiencies have improved tremendously with the large increases in bushels per acre. As the quantity of farmland acres have declined, research and innovation has improved crop genetics, precision machinery and technological advances. As for Indiana’s livestock inventory, some industries have seen growth, such as chickens, hogs and pigs, goats and milk production. It was expected to see a decline in horses since 1925 due to lack of usage in the majority of farm operations. Cattle have declined in the state, especially in the past 15 years due to a combination of factors. In 1925, many families still made their own clothing—hence the need for wool. Today, that need for homemade clothing is not as great, thus likely attributing to the decline in sheep.
Summary
The changes to Indiana’s agriculture industry are more expansive than what we had space for in this article. The industry has seen a significant amount of change in regard to industrialization, production efficiencies, number of farms, farmland acreage, farming operators, resurgence of local foods and much more. In the midst of the evolution, the agriculture industry is still comprised of close-knit families who genuinely care and celebrate its heritage—all the while tackling challenges lying before them.
Want More?
If you would like to learn more information about the nation’s agriculture industry, be sure to visit www.agcensus.usda.gov and explore the numerous tables and maps at various geographic levels.
For those with infinite appetites for historical data, be sure to visit the 1925 Census of Agriculture and the 2012 Census of Agriculture for Indiana.
Notes
- To learn more about the economy in the 1920s versus today, see Jerry Conover, “The Rearview Mirror: A 90-Year Retrospective on Indiana’s Economy,” InContext, May-June 2015, www.incontext.indiana.edu/2015/may-jun/article2.asp.
- An agricultural history resource on 1924 is available via the Indiana Historical Society: Janet Brown, “Curriculum Guide: Mechanization in Agriculture: The Farmer’s Dilemma,” Indiana Historical Society, 2010, https://indianahistory.org/wp-content/uploads/8ffb6250b584adbcc961ece766e3c2b5.pdf.
- Likewise, one could see how it can be difficult to discern where the agriculture industry “ends” within the valued-added process. Some researchers argue that it needs to include manufacturing and wholesale outlets, whereas others only include industries with a sizeable share of raw agricultural input.