Indiana's Trade with BRICS and Emerging Markets
Economists and market analysts are continuously searching the horizon to find the next big thing, the next big market to make a sale.
The hunger for the next big market prompted an economist named Jim O’Neill to identify four countries that had the ability to shift the global economic power away from the “advanced” G7 economies, of which the U.S. is a part.1 These four countries were Brazil, Russia, India and China and earned a well-known moniker, “BRIC.” Recently, many analysts have appended South Africa, turning the moniker into “BRICS.”
However, the question became “Are there any other emerging markets that may rival BRICS in terms of export growth potential?” Likewise, how is Indiana doing relative to the U.S. in exporting to BRICS and these other emerging markets?
Identifying Emerging Markets
To identify other fast-growing economies outside of the BRICS, IBRC researchers evaluated country population, GDP per capita and GDP growth rates between 2002 and 2012. Advanced or developed countries were excluded. Several countries had GDP per capita below $10,000, yet were included due to strong GDP growth rates or large populations (see Table 1).
In total, this analysis examined 18 countries, including all of the BRICS. The additional non-BRICS countries are referred to here as “Plus countries” or “other emerging markets (or economies).” Our shorthand for other emerging markets and the BRICS together is “BRICS Plus.”
Table 1: BRICS and Other Growing Emerging Economies
| Country | Population, 2012 | GDP Growth Rate, 2002-2012 | GDP per Capita, 2012 |
|---|---|---|---|
| Brazil | 198,656,019 | 15.0% | $11,340 |
| Chile | 17,464,814 | 13.3% | $15,363 |
| China | 1,350,695,000 | 17.3% | $6,091 |
| Colombia | 47,704,427 | 13.3% | $7,752 |
| Czech Republic | 10,514,810 | 9.1% | $18,608 |
| India | 1,236,686,732 | 12.6% | $1,489 |
| Kazakhstan | 16,797,459 | 21.0% | $12,007 |
| Malaysia | 29,239,927 | 11.0% | $10,381 |
| Mexico | 120,847,477 | 6.0% | $9,742 |
| Peru | 29,987,800 | 12.4% | $6,573 |
| Poland | 38,542,737 | 9.0% | $12,708 |
| Romania | 21,326,905 | 13.1% | $7,943 |
| Russia | 143,533,000 | 17.6% | $14,037 |
| Saudi Arabia* | 28,287,855 | 11.5% | $20,778 |
| South Africa | 51,189,307 | 12.4% | $7,508 |
| South Korea | 50,004,000 | 6.7% | $22,590 |
| Thailand | 66,785,001 | 10.6% | $5,474 |
| Turkey | 73,997,128 | 12.2% | $10,666 |
* Saudi Arabia did not have 2012 data available at time of analysis. Thus, their data reflect the 2001-2011 time period.
Source: IBRC, using World Bank data
Export Trends
Between 2002 and 2012, the U.S., Midwest and Indiana had strong export growth to the BRICS and other emerging markets. Figure 1 depicts the average annual growth rates over 10 years (2002-2012), during the export rebound period following the recession (2010-2012) and within the most recent year of available data (2011-2012). In the last 10 years, the Midwest region has experienced stronger export growth relative to the U.S. or Indiana. However, Indiana has excelled in more recent years.
Figure 1 : U.S., Midwest and Indiana Export Trends to BRICS Plus Countries
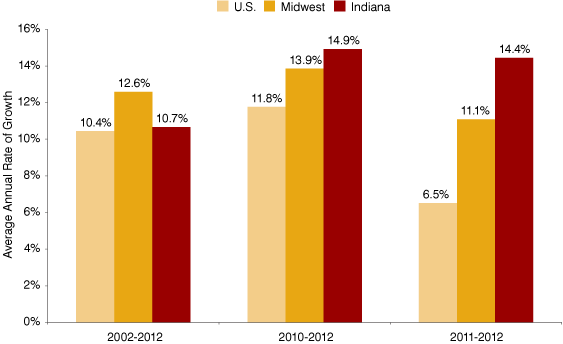
Source: IBRC, using WISER Trade data
This strong export growth from Indiana reflects the commodity mix being imported by the destination countries. When looking at the top 10 Indiana-produced imports for each country, industrial machinery was in the top position across the board—except in the rare case in which it was second. This held true for the BRICS as well as the Plus countries. After industrial machinery, however, things get a little more interesting for the Plus countries.
Regions appeared to have slightly different import profiles. For example, Eastern Europe imports a significant volume of Indiana medical devices and optical instruments but did not import Indiana pharmaceuticals in abundance. Latin American Plus countries did import life science products, except for Mexico. Transportation equipment was the leading commodity group for Mexico to import from the U.S.
The BRICS countries—while not a homogeneous market block due to varying rates of economic growth, import growth and absolute level of imports—did tend to import similar types of products from Indiana and the U.S. The three heavyweights were industrial machinery, transportation equipment and life science products.
One important finding of this analysis: Indiana’s ranking among the states increased and the average rate of export growth outperformed the nation at large for all of the BRICS. This could not be said of the Plus countries.
Other Key Findings
When attempting to identify the next group of emerging markets, it appears that size of the economy and propensity to import are the more important considerations. The full report, “U.S. and Indiana Trade Patterns with the BRICS Countries and Other (Often Overlooked) Emerging Markets,”2 details the top 10 commodities imported by each country, GDP and import growth trends as well as industry export trends. Below is a list of the key findings for the 2002-2012 time span.
-
The BRICS countries all had astonishing economic as well as import growth.
-
The BRICS countries’ appetite for U.S. and Indiana products also accelerated, with the growth rate of Indiana’s exports to the BRICS increasing faster than that of the United States as a whole.
The import volume from the U.S. and Indiana varied dramatically across the BRICS, from a high of China importing $1.3 billion (in non-agricultural goods) from Indiana in 2012 to a low of Russia importing $100 million in 2012.
The Plus countries of Chile, Colombia, Malaysia, Saudi Arabia, South Korea, Thailand and, of course, Mexico all imported more Indiana goods than did Russia in 2012.
-
The growth rates of Indiana’s exports to the BRICS exceeded that of the United States, and the state ranking of Indiana exports improved for all BRICS countries.
The growth rates of Indiana’s exports to the Plus countries were not consistently better or worse than the U.S.
Economic growth for the Plus countries, in aggregate, was about half that of the BRICS, but was still better than the global average.
Import growth from all global sources to the Plus countries was greater than either the U.S. or Indiana.
- Life sciences products ranked highly, making up nearly 60 percent of Indiana exports to South Korea.
Conclusion
The economic block of countries called BRICS have been very much in the news. Their economic growth rates have helped buoy the global economy when the advanced economies were in the throes of the Great Recession.
That said, there are several other emerging markets that eclipse even the BRICS in terms of their imports from Indiana. These “Plus countries” cannot be overlooked in terms of their market potential. In recent years, Indiana’s export growth to the BRICS Plus countries has exceeded the nation and Midwest due to these countries’ appetite for transportation equipment, industrial machinery and life science products.
Given the product groups that Indiana manufacturing specializes in and given the continued rapid economic growth of the BRICS Plus counties, one can say that Indiana is well positioned to expand exports in the coming years.
Notes
- To read the original paper written by Jim O’Neill, see “Building Better Global Economic BRICs” at www.goldmansachs.com/insights/goldman-sachs-research/building-better.
- Read the full report at www.ibrc.indiana.edu/studies/BRICS2013.pdf.