Born Abroad: Recent Immigrants to Indiana
Indiana is not only becoming more racially diverse, but we are becoming more internationally diverse as well. This article explores data on the foreign-born population from the 2011 American Community Survey (ACS) in addition to recent immigration statistics from the U.S. Department of Homeland Security.
Indiana’s Foreign-Born Population
The state’s foreign-born population totaled 307,194, accounting for approximately 5 percent of Indiana’s population, according to the 2011 ACS. This share of the population has seen consistent increases since 2000. In fact, about half (49 percent) of Indiana’s foreign born are fairly new to the country, entering the U.S. in the year 2000 or later.
Nearly half of the foreign-born population hails from Latin America (for both total and recent entrants). Among those entering the U.S. since 2000, we see fewer Europeans and more Asians and Africans living in the state relative to the total (see Figure 1).
Figure 1: Region of Birth for Indiana’s Foreign Born, 2011
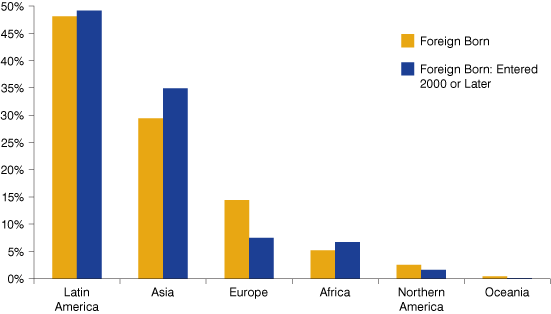
Source: IBRC, using U.S. Census Bureau data
Looking at the population age 25 and older, 33 percent of Indiana's foreign-born population has less than a high school education, compared to 12 percent of the native population (see Figure 2).
Figure 2: Indiana's Educational Attainment by Native and Foreign Born, 2011
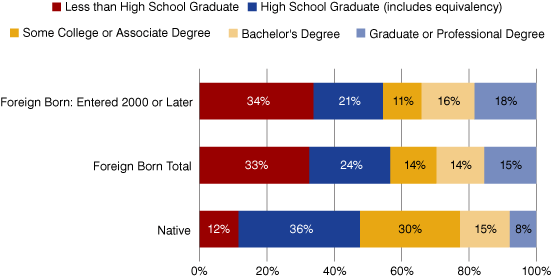
Note: The differences in the levels of attainment between the foreign-born total and recent entrants are not statistically significant. Likewise, the percentage of native-born Hoosiers with bachelor’s degrees is not statistically different from the other bachelor’s degree percentages.
Source: IBRC, using U.S. Census Bureau data
However, a much higher percentage of the foreign-born population has a graduate or professional degree (15 percent) compared to the native-born population in Indiana (8 percent). This higher level of educational attainment might be partially explained by immigration policies that give preference to high-skilled workers, such as the H-1B temporary visa program.
Indiana’s New Legal Permanent Residents
Using data from the U.S. Department of Homeland Security, the number of individuals obtaining legal permanent residence in Indiana (i.e., “green card” recipients) has increased over the past 10 years (see Figure 3). In fiscal year 2012, 8,359 people obtained their green card in Indiana, up 59 percent from 2003 levels.
Figure 3: Persons Obtaining Legal Permanent Resident Status in Indiana, 2003 to 2012
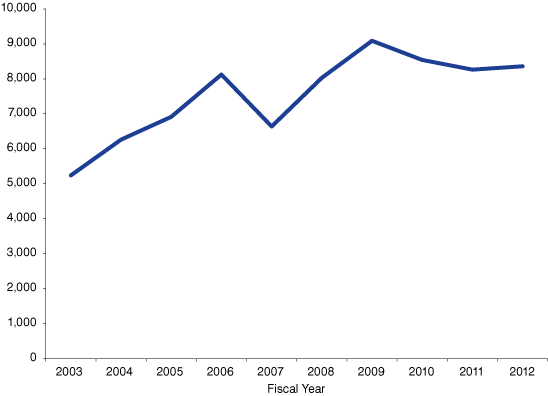
Source: IBRC, using 2012 Yearbook of Immigration Statistics data
More than half of the 2012 green card recipients were from Asia. Figure 4 shows the top 10 countries of birth.
Figure 4: Leading Countries of Birth for Indiana's 2012 Legal Permanent Resident Recipients
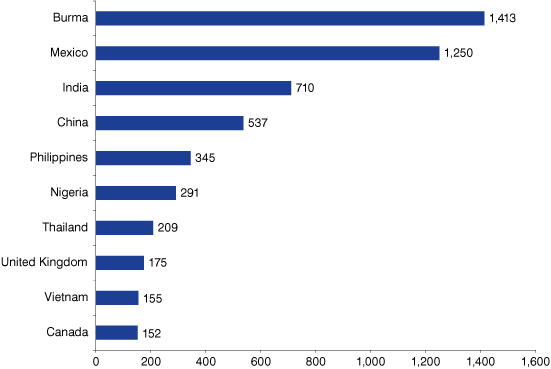
Source: IBRC, using 2012 Yearbook of Immigration Statistics data
Burmese refugees have topped this list since fiscal year 2009.1 Figure 5 shows how the influx of immigrants from the four leading countries has shifted over time.
Figure 5: The Changing Origin of Indiana's New Legal Permanent Residents, 2003 to 2012
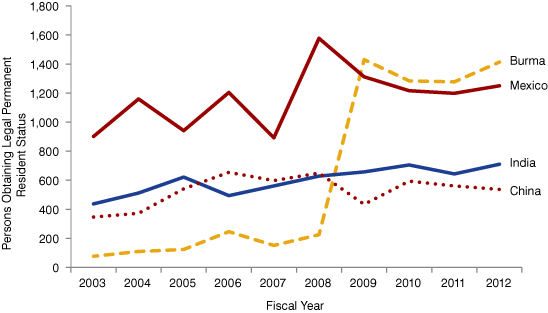
Source: IBRC, using U.S. Department of Homeland Security data
Both Fort Wayne and Indianapolis are home to some of the largest Burmese refugee communities in the nation.2 For fiscal year 2012, Indiana ranked third in the U.S. in the number of Burmese obtaining permanent legal status, behind New York and Texas.
Temporary Nonimmigrants
Some of the foreign-born population only plan to stay in the U.S. temporarily (students and temporary workers, for example). Indiana’s nonimmigrant admissions for 2011 (the most current data available as of the time of this writing) included about 24,500 academic student admissions, along with 18,610 temporary worker and family admissions.
Intracompany transferees (L-1 visas) was the largest category for temporary worker visas in Indiana, with 4,267 admissions. This status is used when a U.S. employer transfers an executive, manager or professional with specialized knowledge from one of its affiliated foreign offices; it is also used when a foreign company sends a manager to the U.S. to establish an office here.3
H-1B visas allow companies to hire foreigners in specialty occupations with hard-to-find skills.4 This was the next largest category of temporary workers for Indiana with 3,337 admissions in 2011. According to research published by the Brookings Institution last year, the Columbus metro had the second-highest demand intensity for H-1B visas among all U.S. metros (that’s calculated as the number of H-1B requests per 1,000 workers) and the vast majority were for engineers or computer specialists.5
Indiana’s Unauthorized-Immigrant Population
Legal immigrants and temporary nonimmigrants are only part of the equation, but estimating the number of people here without a visa is difficult. The Pew Hispanic Center estimates that Indiana has around 110,000 unauthorized immigrants (based on a 2009-2010 average), with a 90 percent confidence interval of 70,000 to 160,000.6 This is about 1.8 percent of the total population, lower than the nationwide rate of 3.7 percent. While California has the largest unauthorized-immigrant population at nearly 2.6 million, Nevada has the largest share as a percent of its total population (7.2 percent).
Learn More
For more information about the immigrant population in Indiana and across the nation, explore the following resources:
- Foreign-Born Population (American FactFinder)
- Immigration Data Sets (Office of Immigration Statistics, U.S. Department of Homeland Security)
- Unauthorized Immigration (Pew Hispanic Center)
Notes
- Those granted refugee and asylum status are required to apply for adjustment to legal permanent resident status after one year of residence in the United States.
- See Michael Puente, “Burmese Refugees Find New Home in Indiana,” National Public Radio, September 30, 2007, www.npr.org/templates/story/story.php?storyId=14841071, and “Burmese Refugee Population in the U.S.” Burmese American Community Institute, 2012, www.baci-indy.org/resources/burmese-refugee-population-in-the-us.
- For more information about the variety of temporary worker visas, see “Temporary (Nonimmigrant) Workers,” U.S. Citizenship and Immigration Services, https://www.uscis.gov/working-in-the-united-states/temporary-nonimmigrant-workers.
- Jonathan Rothwell and Neil G. Ruiz, “H-1B Visas and the STEM Shortage,” Brookings Institution, May 10, 2013, www.brookings.edu/articles/h-1b-visas-and-the-stem-shortage/.
- Neil G. Ruiz et al., “The Search for Skills: Demand for H-1B Immigrant Workers in U.S. Metropolitan Areas,” Brookings Institution, July 18, 2012, www.brookings.edu/articles/the-search-for-skills-demand-for-h-1b-immigrant-workers-in-u-s-metropolitan-areas/.
- Pew Hispanic Center, “Unauthorized Immigrant Population: National and State Trends, 2010,” February 2011, www.pewresearch.org/2011/02/01/unauthorized-immigrant-population-national-and-state-trends-2010/.