Changing Trends: Cities and Towns Gaining Population
Earlier this year, we wrote that unincorporated areas have grown faster than cities and towns since 2000.1 However, with the recent release of the 2007 sub-county population estimates, we see a different trend emerging.
If one looks at the full 2000–2007 time span, unincorporated areas still come in at the top, with an increase of roughly 153,000 people (7.3 percent) compared to nearly 112,000 people (2.8 percent) in cities and towns.2 However, if one focuses on the 2005–2007 time span, cities and towns have the edge, as shown in Figure 1, increasing by almost 62,000 people (1.5 percent) while unincorporated areas grew by slightly more than 26,000 (1.2 percent).
Figure 1: Numeric Growth in Incorporated and Unincorporated Areas, 2000 to 2007
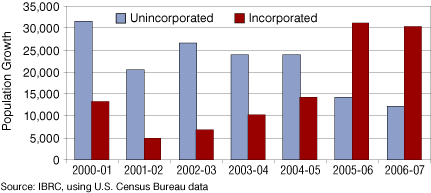
Indeed, for the first five years of the decade, growth in unincorporated areas outpaced incorporated places on both a numeric and percentage basis, but since 2005, the trend has changed dramatically (see Table 1).
Table 1: Change in Population for Incorporated and Unincorporated Areas
| Year | Unincorporated |
Incorporated |
||||
Population |
Numeric Change |
Percent Change |
Population |
Numeric Change |
Percent Change |
|
| 2000* | 2,092,427 | n/a | n/a | 3,988,094 | n/a | n/a |
| 2001 | 2,124,022 | 31,595 | 1.5% | 4,001,503 | 13,409 | 0.3% |
| 2002 | 2,144,614 | 20,592 | 1.0% | 4,006,488 | 4,985 | 0.1% |
| 2003 | 2,171,168 | 26,554 | 1.2% | 4,013,351 | 6,863 | 0.2% |
| 2004 | 2,195,164 | 23,996 | 1.1% | 4,023,699 | 10,348 | 0.3% |
| 2005 | 2,219,071 | 23,907 | 1.1% | 4,038,050 | 14,351 | 0.4% |
| 2006 | 2,233,349 | 14,278 | 0.6% | 4,069,297 | 31,247 | 0.8% |
| 2007 | 2,245,471 | 12,122 | 0.5% | 4,099,818 | 30,521 | 0.8% |
Source: U.S. Census Bureau
Where Is the Growth?
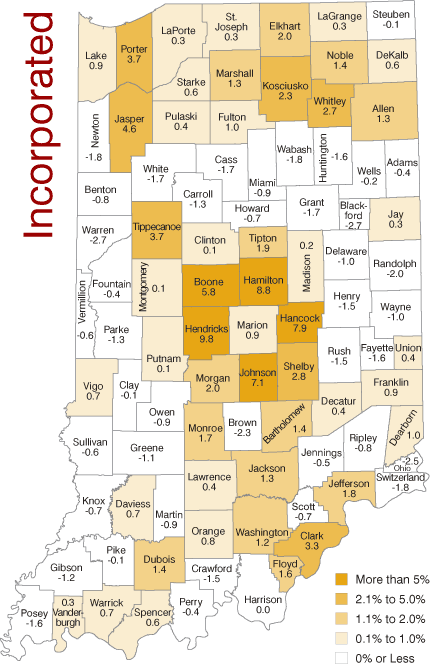
Since 2005, the fastest growth in incorporated areas has been concentrated in five of the Indianapolis suburban counties (see Figure 2). In fact, the incorporated growth in Hendricks, Hamilton, Hancock, Johnson and Boone counties (32,458 people) accounts for 29 percent of the statewide growth in cities and towns. Three of those counties are also among the top five from a numeric perspective, which includes Hamilton, Marion, Hendricks, Johnson and Lake counties. If looking at this set of five counties, they account for 36 percent of the statewide growth in cities and towns. Overall, 50 of Indiana's 92 counties have seen growth in their incorporated places since 2005, with 25 counties growing by more than 1 percent.
Figure 2: Percent Change in Population in Incorporated and Unincorporated Areas by County, 2005 to 2007
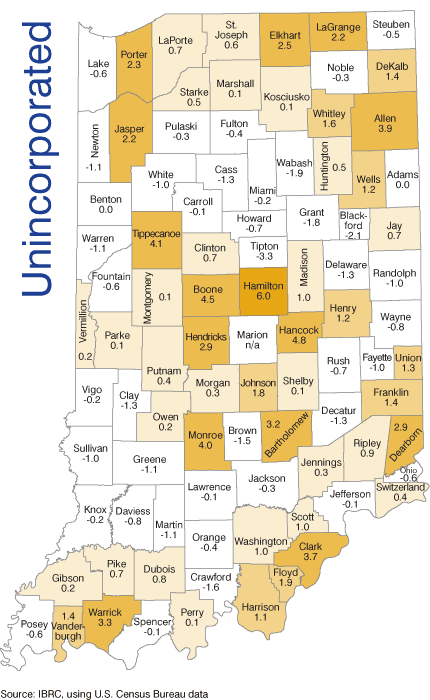
Similarly, 50 counties experienced growth in their unincorporated areas, with half of those growing by more than 1 percent. Growth in unincorporated areas outpaced that of cities and towns for the 34 counties shown in Figure 3.
Figure 3: Counties Where Unincorporated Areas are Growing Faster than Cities and Towns, 2005 to 2007
How Have the Growth Rates Changed?
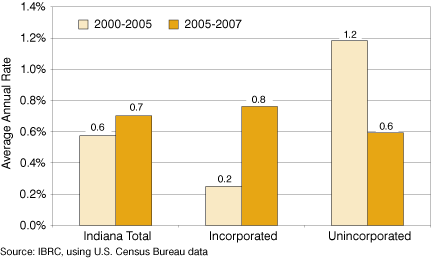
Since we cannot directly compare the 2000–2005 percent change to the 2005–2007 change (because of the different number of years involved), we must calculate the annual average rate of change. For the state as the whole, the annualized rate was 0.6 percent for the first five years of the decade and 0.7 percent for the 2005–2007 time span. The annual rate for incorporated places increased from 0.2 percent to 0.8 percent, while the rate for unincorporated areas declined from 1.2 percent to 0.6 percent (see Figure 4).
Figure 4: Indiana's Annual Rate of Change, 2000 to 2007
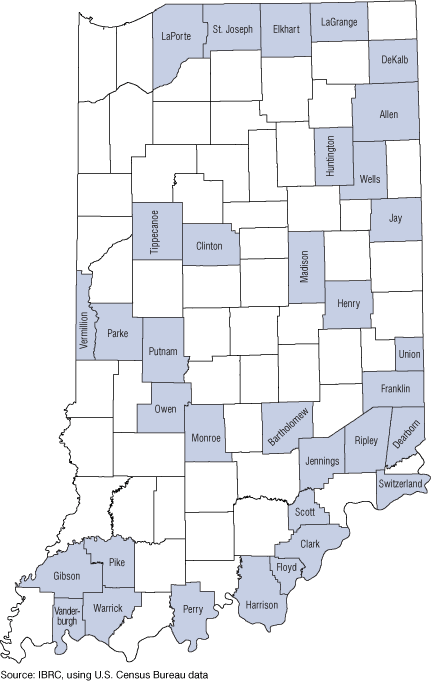
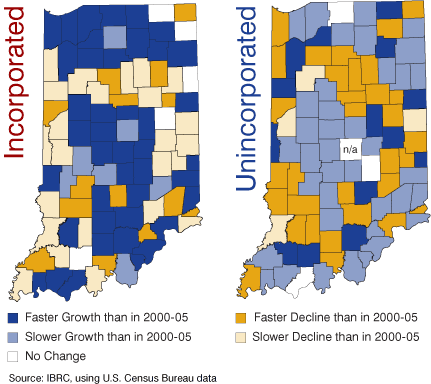
When looking at the county-level in Figure 5, we see that incorporated areas in 41 counties grew faster on average in the 2005–2007 time span than earlier in the decade. (It is worth pointing out, however, that in some cases this “growth” might be better described as a recovery due to the larger losses experienced in the 2000–2005 period.) An additional 24 counties experienced a slower decline in their cities and towns than in prior years. Meanwhile, we see 70 counties with either a slower growth or a faster decline in their unincorporated areas when compared to the 2000–2005 rates. However, 14 counties have seen faster growth in their unincorporated areas in recent years when compared to 2000–2005 growth.
Figure 5: Change in Annual Growth Rate from 2000–2005 and 2005–2007
What is causing this new trend? Could it be that high gas prices are enticing more people to live closer to their jobs? Or perhaps the housing slump is creating some bargains in the city even as new construction on the outskirts slows down. Unfortunately, these data do not give us all the answers, but they do point to a shift in where Hoosiers call home.
Notes
- Rachel Justis, "Increasing Unincorporation," InContext, March 2008, www.incontext.indiana.edu/2008/march/2.asp.
- These estimates are adjusted for boundary changes, such as annexations, so the resulting numbers reflect actual demographic changes and not changes due to shifting boundaries.
Rachel Justis, Geodemographic Analyst
Indiana Business Research Center, Kelley School of Business, Indiana University