Latest Personal Income Stats
Personal income is one of the more closely monitored measures of an economy's vitality, as it represents the income that individuals receive from all sources and thus have available for consumption, investments or savings. When personal income grows more rapidly, we expect these uses to increase, thereby propelling further economic growth.
This expectation has led several states and regions to set economic goals targeting a certain growth rate in personal income, often in the form of per capita personal income (PCPI). PCPI, which is simply total personal income (TPI) divided by the population, is easily understood as the average income received from all sources by the residents of a given area. PCPI goals are often targeted to equal or exceed the nation's PCPI. Indiana's economic strategic plan, for instance, aims to eventually raise the state's PCPI to the national level.
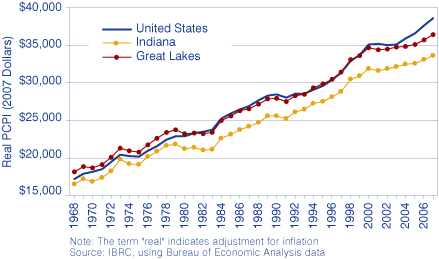
This is a very ambitious goal despite the fact that Indiana's PCPI has more than doubled over the past 40 years, even after adjusting for inflation (see Figure 1). Matching the U.S. PCPI seems increasingly challenging when we observe that Indiana's PCPI has declined relative to the nation for many years—down to its 2007 level of 87 percent of this target. Moreover, as shown in Figure 1, the U.S. PCPI has accelerated in recent years following the recession in the early 2000s, while PCPIs in Indiana and the Great Lakes region have grown more slowly.1 To find out why, we need to look more closely at the composition of total personal income from which the per capita figures are derived.
Figure 1: Real Per Capita Personal Income, 1968 to 2007
Indiana's total personal income has increased every year for many decades, as has the nation's. The nation's income growth, however, has outpaced that of Indiana in many of those years, more often than the reverse. In an insightful analysis elsewhere in this issue, Morton Marcus explores the nature and volatility of TPI growth in the nation and Indiana. He observes that the state has lagged the nation in income growth for seven straight quarters as of the most recent preliminary data from the Bureau of Economic Analysis.2
The present article seeks additional insight into why Indiana's income growth has been slower than the nation's by examining the components that make up total personal income. The main TPI components are:
- Net earnings by place of residence: salaries, wages, employer contributions to pensions and insurance plans, and income received by sole proprietors and partners.
- Dividends, interest and rent received by persons: sometimes referred to as “investment income” or “property income.”
- Personal current transfer receipts: payments to persons for which no current services are performed. Examples include retirement and disability insurance benefits, Medicare and Medicaid, welfare payments and unemployment benefits, veterans' benefits, and federal grants and loans to students.
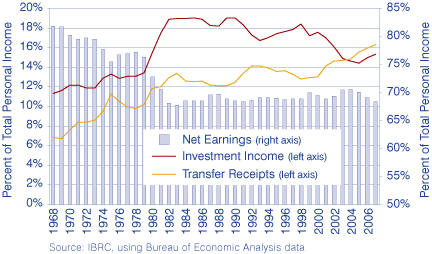
As shown in Figure 2, net earnings in 1968 represented around 80 percent of Indiana TPI, whereas earnings have comprised about 70 percent of TPI for the last quarter century. Most of this decline took place from the mid-1970s to the early 1980s, during which time transfer receipts gained gradually in share of TPI while investment income's share grew rapidly. For example, in the 10 years between 1973 and 1983, the contribution of earnings to Indiana TPI shrank by 11.8 percentage points, giving ground to investment income (+7.1 points) and transfer receipts (+4.7 points). These notable shifts reflected multiple broad structural changes in the economy: the migration of manufacturing operations from the “Rust Belt” region to the “Sun Belt,” increased government spending on entitlement programs and increased ownership of securities by a broader range of individuals, among others.
Figure 2: Component Shares of Indiana Total Personal Income, 1968 to 2007
Similar shifts were observed during this period in the composition of personal income at the national level, although the drop in earnings' share (and concomitant rise in shares for investments and transfer receipts) was not as pronounced. Indiana experienced a much larger percentage decline in manufacturing employment during the 1973–1983 decade than did the nation, so a larger effect on the net earnings share of personal income is not surprising.
Since the early 1980s, earnings have maintained a fairly steady 70 percent share of Indiana TPI. At the same time, investment income's share of Indiana TPI has slipped about 4 percentage points, while the share representing transfer receipts has risen by more than 3 points. A similar pattern is found at the national level, but with a less pronounced shift nationally between transfer receipts and investment income.
Moreover, as shown in Figure 3, there is a rather dramatic contrast between Indiana and the United States in TPI component growth in recent years—transfer receipts grew at a somewhat faster rate in Indiana than in the nation from 2003 to 2007, while the national growth rates for net earnings and investment income during this period far exceeded Indiana's rates.
Figure 3: Percent Growth in Components of Personal Income, 2003 to 2007
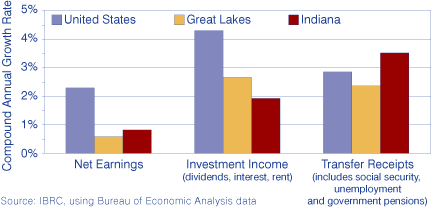
PI component changes in the Great Lakes region varied: the region's net earnings grew more slowly than Indiana's, its investment income growth was slightly faster than Indiana's, and its transfer receipts grew more slowly than those of either the United States or Indiana.
What accounts for the state's slower growth than the nation's with respect to investment income and net earnings? What aspect of transfer receipts has driven its steadily increasing share of Indiana's total personal income? Exploration of these important questions will be revealed in future analysis.
Notes
- All personal income figures in this article are expressed in real (inflation-adjusted) terms of 2007 dollars. The figures for 2007 are preliminary and subject to future revision by the BEA.
- Marcus' analysis of quarterly TPI data finds that the state's personal income is more volatile than the nation's. This relationship is exacerbated when using quarterly data (the present analysis uses the less volatile annual figures).
Jerry Conover, Director
Indiana Business Research Center, Kelley School of Business, Indiana University