The Cincinnati-Middletown Metro Story: Told by STATS Indiana
This is the seventh in a series of articles on Indiana's metropolitan statistical areas (metros). All the data used in this article can be found using the USA Counties and Metros Side-by-Side feature on STATS Indiana (www.stats.indiana.edu).
The Area
The Cincinnati-Middletown metro includes counties from Ohio, Kentucky and Indiana. The main cities—both Cincinnati and Middletown—are located in Ohio. Indiana is the smallest portion of the metro both in number of counties and population. Of the fifteen counties included in the metro, three are within Indiana's borders: Dearborn, Franklin and Ohio counties. These three counties comprise 3.7 percent of the metro's population. However, the Indiana portion of the metro has also seen a larger increase in population over the long haul. From 1990 to 2007, the Indiana portion of the metro grew 23.6 percent—faster than the metro as a whole (15.7 percent), Indiana (14.5 percent) or the United States (21.2 percent).
Despite the fact that the Indiana portion of the metro is so small relative to the entire metro, it plays an important role in the metro economy. For example, let's take a look at the components of population change in the Indiana portion of the metro. Dearborn, Franklin and Ohio counties combined saw positive net domestic migration, positive net international migration, and natural increase (more births than deaths) in 2007. Meanwhile, the metro as a whole saw a negative net domestic migration. What does this mean? It appears as though residents of the metro are moving elsewhere. More specifically, it looks like domestic migrants are moving into the Indiana portion of the metro but not the rest of the metro, perhaps in an attempt to be close, but not too close, to the big cities where their jobs are likely located.
Jobs and Wages
The Cincinnati-Middletown metro supplies more than one million jobs within the U.S. economy. As an entire metro, health care and social assistance was the industry with the highest employment proportion (12.4 percent); manufacturing was second (12 percent) and retail trade was third (10.8 percent). Indiana and the United States were, not surprisingly, the most similar in terms of top five industries (see Figure 1). The smaller the geography, the more likely it is that we will find different niche industries. For example, the Cincinnati metro did not have educational services among its top five industry sectors, but instead had administrative and waste services. Likewise, the Indiana portion of the Cincinnati-Middletown metro differed from the state and nation in that arts, entertainment and recreation, as well as public administration were among the top five industry sectors in the area.
Figure 1: Five Industries with Highest Employment by Geography
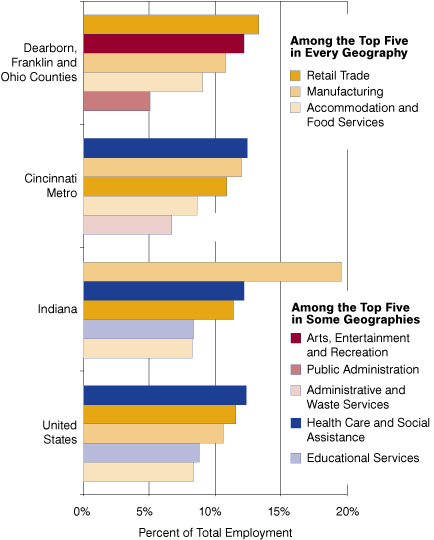
To further stress the differences between geographies, we see that—unlike most Hoosier data—the numbers for the Indiana portion of the Cincinnati-Middletown metro show that retail trade was the industry employing the greatest proportion of workers in the area, as opposed to manufacturing, which tends to rank first in most Indiana geographies. In fact, manufacturing ranked third in the Indiana portion of the metro. That said, it is important to note that only four industries in the Indiana portion of the metro weren't flagged with nondisclosure notes. Those industries included construction, retail trade, transportation and warehousing, and accommodation and food services, so it is only in these industries that we can have a true comparison across geographies; the other numbers only give us a starting off point.
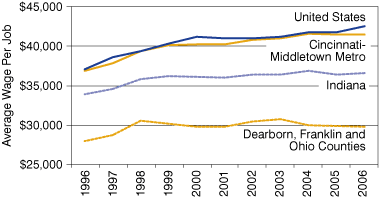
From 1996 to 2006, jobs in the Cincinnati-Middletown metro have been fairly consistent with the U.S. trend and consistently higher than Indiana's average wages per job (see Figure 2). The Indiana portion of the Cincinnati-Middletown metro is at the low end of the scale for average wages per job, both numerically and in change over time. During those 10 years, the Indiana portion of the metro grew 6.3 percent, Indiana grew 7.7 percent, the metro as a whole grew 12.3 percent and the nation grew 14.8 percent, thus widening the gap between the U.S. wages and every other geography in this comparison.
Figure 2: Average Wage Per Job, 1996 to 2006
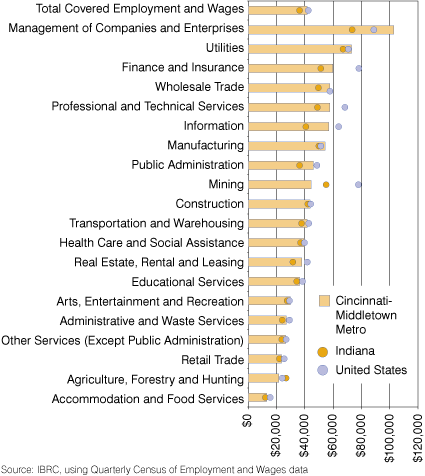
As far as individual industry sectors are concerned, management of companies and enterprises paid the highest in the Cincinnati-Middletown metro, averaging nearly $103,000 (see Figure 3). Of the five industries with the most jobs in the metro, manufacturing paid the most, with an average wage of about $46,600. Health care and social assistance (the largest industry in the metro), paid approximately $39,800 among workers in the field. This was more than the Indiana average for the health care industry ($37,018) and slightly higher than the average wages paid in the United States for the same industry ($39,760). The health care industry was one of five industries in the metro to pay higher average wages than the United States. However, we must keep in mind that the same nondisclosure issues that appeared in the jobs data also hold true in the wage data, as all of it is compiled from the Quarterly Census of Employment and Wages.
Figure 3: Average Wage Per Job in the Cincinnati-Middletown Metro, Indiana and the United States, 2006
Conclusion
Since the Indiana portion of the Cincinnati-Middletown metro is so small, it is difficult to compare the three counties to the metro overall, the state or the nation. For one, neither of the two largest cities in the metro are located within Indiana's state boundary, which results in the Indiana portion not stacking up so well against the other geographies when looking strictly at the data. Secondly, because the area is so small, many of the data are nondisclosable, making a comparison even more difficult. The good news is that the population data show increased migration and a natural increase in the three Indiana counties, perhaps indicating that even if the Indiana portion of the metro isn't where people are finding jobs, they do find it a pleasant place to live.
Molly Manns, Associate Editor
Indiana Business Research Center, Kelley School of Business, Indiana University