The Indianapolis-Anderson-Carmel CSA
This article is the fifth of seven highlighting each of Indiana's combined statistical areas (CSAs). CSAs are groupings of predefined metropolitan (metro) and/or micropolitan (micro) areas that, as the title suggests, combine these areas to “represent larger regions and reflect broader social and economic interactions.” (1)
The Area
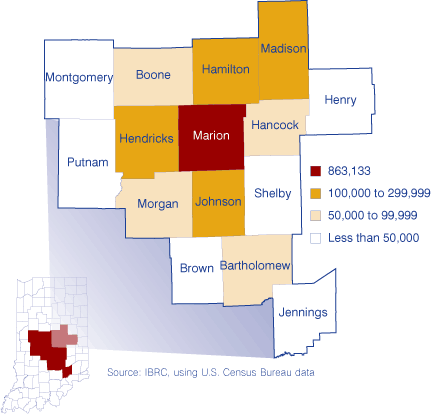
There are 15 counties included in the Indianapolis-Anderson-Columbus CSA: Bartholomew, Boone, Brown, Hamilton, Hancock, Hendricks, Henry, Jennings, Johnson, Madison, Marion, Montgomery, Morgan, Putnam and Shelby. This is the largest self-contained combined statistical area in Indiana. The Cincinnati-Middletown-Wilmington and Chicago-Naperville-Michigan City combined areas are both larger in population than the Indianapolis-Anderson Columbus CSA but most of their populations live outside the Indiana state lines. The 15 counties that make up the CSA accounted for nearly one-third of Indiana's 6.3 million residents in 2005. Figure 1 shows how each of the 15 counties contributes to the CSA's population. The area's population has had significant growth over the past five years, averaging more than 19,000 new residents each year.
Figure 1: Indianapolis-Anderson-Carmel CSA Population by County, 2005
Jobs
Jobs in the Indianapolis-Anderson-Columbus CSA have risen since 2003 (see Figure 2). Compared to the state overall, the Indianapolis-Anderson-Columbus CSA seems to be performing well. From the second quarter of 2001 to the same quarter in 2006, jobs have increased 2.5 percent in the CSA, more than 2 percentage points higher than Indiana's increase (see Table 1). Jobs in Indianapolis are somewhat more diverse than the state overall. For example, manufacturing made up 13.5 percent of jobs in the area, but 19.6 percent of jobs statewide. The retail trade sector and the health care and social services sector (the other two sectors with at least a 10 percent share of jobs) also contributed to a lower percentage of jobs in the CSA than they did in Indiana, allowing for more workers in other industries.
Figure 2: Jobs and Average Weekly Wages in the Indianapolis-Anderson-Carmel CSA*
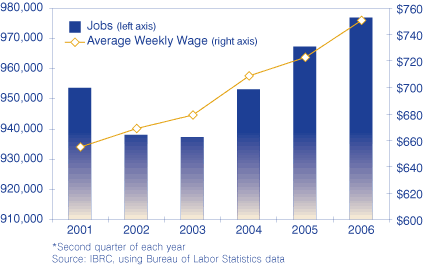
Table 1: Change in Jobs in the Indianapolis-Anderson-Carmel CSA and Indiana, 2001:2 to 2006:2
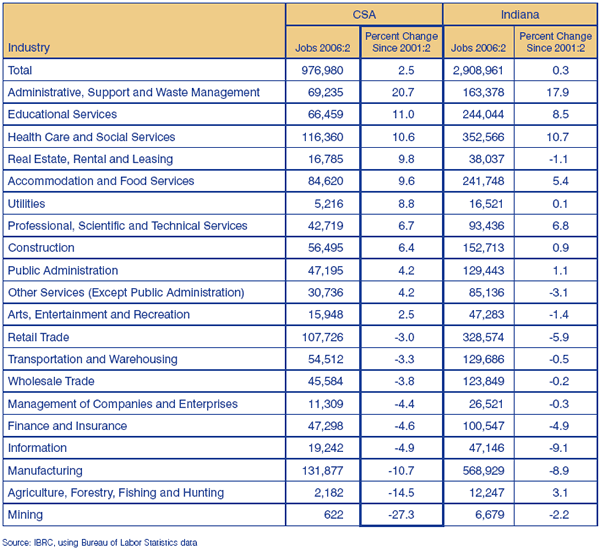
It appears the Indianapolis-Anderson-Columbus CSA helped compensate for job losses elsewhere in the state, with an increase of about 23,400 jobs from 2001 to 2006, almost three times Indiana's 7,900 overall increase in jobs. So which industries were responsible for the major gains experienced in the CSA? Numerically, the administrative, support and waste management sector contributed the most jobs, followed closely by health care and social services.
Wages
Average weekly wages in the Indianapolis-Anderson-Columbus CSA have been climbing since 2001; even when the total number of jobs dropped, average weekly wages continued to grow (as shown in Figure 2). Since 2001, the CSA has seen an increase of $96 per week across all industry sectors to reach a weekly paycheck averaging $751 (see Figure 3). These figures weren't quite as high for Indiana, which increased wages over that period by $89, up to $685 per week.
Figure 3: Comparison of Average Weekly Wages, 2006:2
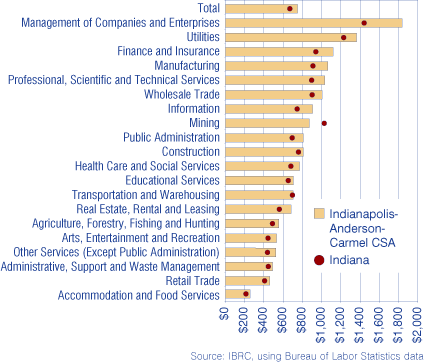
Management of companies and enterprises saw the largest increase over that time, up $369 to reach a weekly wage of $1,837. However, only 1.2 percent of workers in the area were directly affected by this dramatic change. Of those sectors that comprised at least 3 percent of jobs in the area, public administration saw the highest increase in weekly wages (up $170) while finance and insurance paid the most ($1,120 per week).
None of the 20 major industry sectors saw a decrease in average weekly wages over the five-year span in either the CSA or the state overall. Accommodation and food services saw the smallest increases in pay, up $21 and $23 in weekly wages over the five years in Indiana and the Indianapolis-Anderson-Columbus CSA, respectively.
Commuting
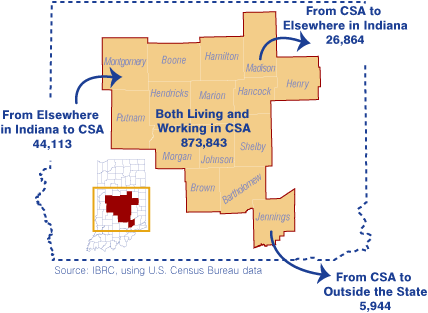
There were more than 900,000 workers living in the Indianapolis-Anderson-Columbus CSA according to Census 2000 data. Of those, only 68.2 percent lived and worked in the same county and another 28.2 percent traveled to one of the 14 other counties within the combined statistical area. More than 44,000 people lived outside the CSA and commuted into the area for work. Meanwhile, about 33,000 workers left the CSA to either work elsewhere in Indiana or outside the state (see Figure 4).
Figure 4: Commuting Patterns in the Indianapolis-Anderson-Carmel CSA, 2000
Notes
- U.S. Office of Management and Budget, available at www.whitehouse.gov/omb/.
Molly Manns, Associate Editor
Indiana Business Research Center, Kelley School of Business, Indiana University