As the Workforce Churns: Indiana's 2005:3 Quarterly Workforce Indicators
Churn: the stirring, agitating or mixing of a substance or commodity. In many respects, it describes what happens in the workforce every day. The U.S. Census Bureau's Local Employment Dynamics (LED) program and its Quarterly Workforce Indicators (QWI) data set captures this phenomenon on a quarterly basis. This set of economic indicators—including employment, job creation, wages and worker turnover—can be viewed at different levels of geography (state, county, metro and workforce investment area), as well as by detailed industry, gender and age of workers. (1)
What the QWIs Tell Us about Indiana's Workforce
Total employment in Indiana was 2,840,413 in the third quarter of 2005, with 20.4 percent of those workers in manufacturing, followed by retail trade at 11.5 percent (see Table 1).
Table 1: Quarterly Workforce Indicators by Industry, 2005:3
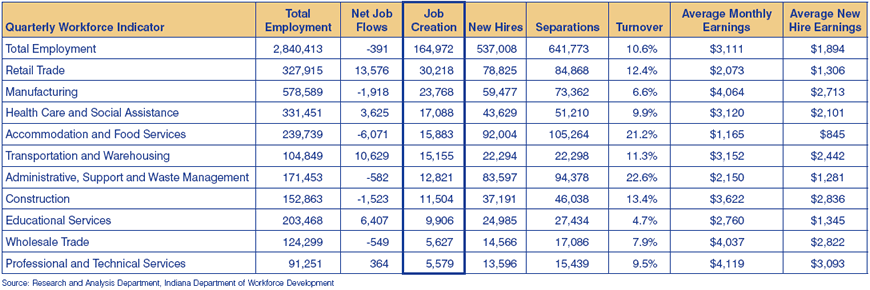
Net job flow is the difference between current quarter and previous quarter employment at each business (net employment change). This addresses which industries are expanding or contracting their employment. The net job flow was ‑391 for the state. Retail trade had the highest net job flow of any industry at 13,576, followed by transportation and warehousing at 10,629.
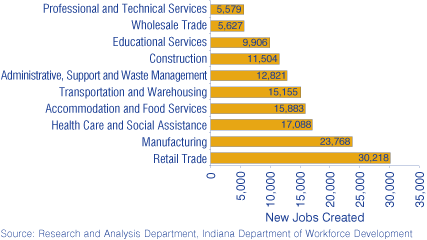
Job creation is the number of new jobs created by either new businesses or expanding employment in existing firms. Employers in the state created 164,972 jobs during the third quarter of 2005. About 18 percent of total job creation occurred in retail trade and 14.4 percent in manufacturing. Another 10.4 percent were created in health care and social assistance (see Figure 1).
Figure 1: Top 10 Industry Sectors for Job Creation, 2005:3
New hires are the total number of accessions that also were not employed by that employer during any of the previous four quarters, while separations are the total number of workers who were employed by a business in the reference quarter but not in the subsequent quarter. There were 537,008 new hires and 641,773 separations in the state. Accommodation and food services led all industries in both new hires and separations.
Turnover rate is calculated by using the formula: (½) * (accessions + separations) / employment. The turnover rate in Indiana was 10.6 percent, but ranged from 2.5 percent in utilities to 22.6 percent in administrative, support and waste management (which includes temporary employment agencies).
Average monthly earnings were $3,111 statewide for all employees, with a low of $1,165 in accommodation and food services and a high of $5,319 in utilities. Average new hire earnings of $1,894 were 61 percent of the average monthly for all workers, with the lowest in accommodation and food services at $845 and a high of $4,108 in utilities.
Demographics
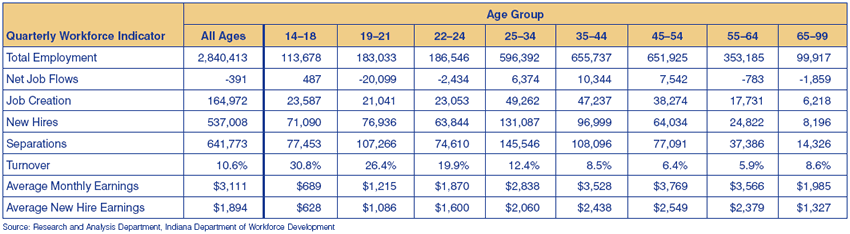
The 35–44 age group was largest in terms of employment, representing 23.1 percent of total employment, followed closely by the 45–54 age group at 22.9 percent (see Table 2). The group with the highest net change was again the 35–44 year olds, with 10,344 net job flows. However, it was the 25–34 age group that led the way in job creation, with nearly 30 percent of the jobs created during this period being held by this age group. This was also the category with the most new hires (24.4 percent) and separations (22.7 percent). Turnover was greatest in the 14–18 age group at 30.8 percent. And finally, workers with lots of experience (between the ages of 45 and 54) took home the biggest paychecks, averaging $3,769 for all workers and $2,549 for new hires.
Table 2: Quarterly Workforce Indicators by Age Group, 2005:3
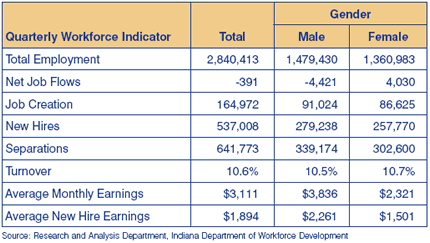
There were more men than women for the following QWIs: total employment, job creation, new hires and separations (see Table 3). The net job flow data indicate that while 4,421 fewer men were employed in 2005:3 than in the previous quarter, there were 4,030 more women employed in Indiana. Turnover was slightly higher among females than males (10.7 percent compared to 10.5 percent for men). Women's average monthly earnings comprised only 60.5 percent of men's ($2,321 for women compared to $3,836 for men). Similarly, male new hires earned $2,621 per month on average vs. $1,501 for females (57 percent of male new hires earnings).
Table 3: Quarterly Workforce Indicators by Gender, 2005:3
More information is available at the LED website (https://onthemap.ces.census.gov/). Two different tools enable users to query the data by year, quarter, area, industry, age and gender. The QWI Online tool gives access to the eight indicators discussed here, while the Industry Focus tool allows more in-depth industry analysis using rankings and charting by demographics.
Notes
- The QWIs are built upon wage records in the Unemployment Insurance (UI) system and information from state Quarterly Census of Employment and Wages (QCEW) data. The universe of QWI data is UI-covered earnings, which includes over 90 percent of total wage and salary civilian jobs. The Census Bureau then attaches age and gender demographics.
When QWI employment numbers are compared with other employment data, exclusions to UI coverage should be taken into account. Exempted employment varies slightly from state to state due to variations in state unemployment laws, but generally excludes many farmers and agricultural employees, domestic workers, self-employed non-agricultural workers, members of the military, as well as certain types of nonprofit employers and religious organizations (which are given a choice of coverage or non-coverage in a number of states). While this report does not include federal government workers, most state and local government employees are included in the complete QWI database.
Terry Brown, Research and Analysis Department
Advanced Economic and Market Analysis Group, Indiana Department of Workforce Development