Hoosier Engines of Job Growth
One of Indiana's engines for job growth and job creation actually has engines: the auto industry. Despite widespread contraction in this industry, concentrated among domestic auto makers, Indiana's employment in the automobile manufacturing industry (NAICS 3361, manufacturing entire vehicle, not auto parts) grew 53 percent between 1997 and 2006, according to annual averages from Current Employment Statistics (CES).
Based on September CES not-seasonally adjusted estimates, national employment in this industry sector declined 3.6 percent since September 2006, while Indiana employment grew 4.6 percent during that same period; that's 600 new jobs. Texas was the only other state reflecting employment growth over the year (see Table 1, which is ranked by 2006 share of U.S. employment).
Table 1: Automobile Manufacturing for States that Publish Monthly Break-Outs of Auto Manufacturing
| State | Employment |
Percent of United States |
Percent Change |
|||||
1997* |
2006* |
September 2007 |
1997 |
2006 |
Change |
1997–2006 |
September 2006–2007 |
|
| Michigan | 84,700 | 56,800 | 51,200 | 29.5 | 24.1 | -5.5 | -32.9 | -10.8 |
| Ohio | 36,800 | 28,000 | 26,000 | 12.8 | 11.9 | -1.0 | -23.9 | -5.1 |
| Kentucky | 17,000 | 16,400 | 17,100 | 5.9 | 6.9 | 1.0 | -3.5 | -2.8 |
| Missouri | 18,600 | 12,800 | 11,000 | 6.5 | 5.4 | -1.1 | -31.2 | -3.5 |
| Indiana | 8,100 | 12,400 | 13,700 | 2.8 | 5.3 | 2.4 | 53.1 | 4.6 |
| Alabama | 1,600 | 12,300 | 12,100 | 0.6 | 5.2 | 4.7 | 668.8 | -0.8 |
| Texas | 5,600 | 8,900 | 10,000 | 2.0 | 3.8 | 1.8 | 58.9 | 6.4 |
| California | 7,000 | 8,700 | 8,400 | 2.4 | 3.7 | 1.2 | 24.3 | -2.3 |
| Oklahoma | 4,300 | 3,100 | 2,600 | 1.5 | 1.3 | -0.2 | -27.9 | -3.7 |
| United States | 286,800 | 236,100 | 228,800 | -17.7 | -3.6 | |||
Note: Data are not seasonally adjusted
Source: Indiana Department of Workforce Development, using Current Employment Statistics data
Indiana's auto manufacturing growth has been largely fueled by the addition of non-domestic auto makers to the mix, including Toyota, Honda and Subaru. Greensburg's Honda plant, set to open in 2008, (1) will bring an additional 2,000 jobs to this industry. In addition, a Toyota/Subaru collaborative venture announced last year (2) is expected to add 1,000 jobs in the Lafayette area during 2007.
Another industry segment in the transportation sector, motor vehicle body and trailer manufacturing (NAICS 3362)—which includes motor vehicle bodies, truck trailers, motor homes, travel trailers and campers—has grown by 49.6 percent (13,100 jobs) between 1997 and 2006 in Indiana, compared to U.S. growth of 13.9 percent (22,000 jobs). Employment in this industry surged in 2006 in response to emergency housing demands in the wake of Hurricane Katrina and has been shedding jobs over the last 12 months, both nationally and in Indiana. However, Indiana employment appears to be stabilizing, with August 2007 employment of 37,500 matching that of August 2005.
Another strong growth segment within the manufacturing sector is medical equipment and supplies manufacturing (NAICS 3391), tucked away in the miscellaneous manufacturing sector and concentrated around Warsaw in Kosciusko County. This industry includes manufacturers who produce surgical supplies and appliances such as prosthetic joints or vascular stents. It grew 28.5 percent from 1996–2007 and had 18,200 employees as of September 2007.
During the last decade, Indiana's total nonfarm employment grew by 115,000 (4 percent). While employment in manufacturing declined during this period (-13.2 percent compared to -18.5 percent for the nation), other sectors and subsectors exhibited substantial growth (three or more times Indiana's overall growth rate)—a fact sometimes obscured by countering movements among other industry components. These high growth subsectors are shown in Figure 1.
Figure 1: Percent Change in Employment for Selected Industries in Indiana and the United States, 1997 to 2006
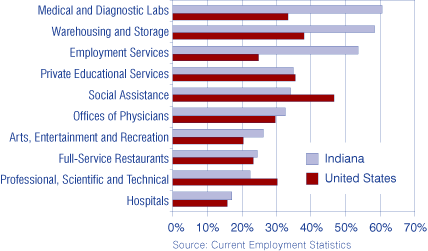
Employment in the warehousing and storage (NAICS 493) sector of trade, transportation and utilities grew by 58.5 percent over the decade, adding 8,600 jobs (see Table 2). Thanks to Indiana's central location and deliberate efforts to attract and support employers in this industry segment, Indiana's employment growth since 1997 has surpassed the strong national trend of 37.9 percent. Growth in this sector is masked by a 4.9 percent decrease in retail trade employment over the 10-year span.
Table 2: Indiana's Hot Industries—Employment in Indiana and the United States, 1997 to 2006
| Industry Segment/Sector | Indiana |
U.S. |
|||
1997 |
2006 |
Change |
Percent Change |
Percent Change |
|
| Medical and Diagnostic Labs | 3,300 | 5,300 | 2,000 | 60.6 | 33.4 |
| Warehousing and Storage | 14,700 | 23,300 | 8,600 | 58.5 | 37.9 |
| Employment Services | 54,000 | 83,000 | 29,000 | 53.7 | 24.9 |
| Private Educational Services | 48,700 | 65,700 | 17,000 | 34.9 | 35.4 |
| Social Assistance | 30,400 | 40,800 | 10,400 | 34.2 | 46.7 |
| Offices of Physicians | 35,600 | 47,200 | 11,600 | 32.6 | 29.7 |
| Arts, Entertainment and Recreation | 34,300 | 43,300 | 9,000 | 26.2 | 20.4 |
| Full-Service Restaurants | 76,500 | 95,200 | 18,700 | 24.4 | 23.3 |
| Professional, Scientific and Technical | 76,200 | 93,200 | 17,000 | 22.3 | 30.3 |
| Hospitals | 87,700 | 102,800 | 15,100 | 17.2 | 15.8 |
The 27 percent growth in professional and business services (NAICS 54) resulted in 59,700 employees and has come primarily from two subsectors: professional, scientific and technical services, which added 17,000 jobs and grew 22.3 percent; and employment services, which expanded by 53.7 percent, adding 29,000 employees during the period (see Table 2). Employment services jobs have exploded as labor leasing and other innovations aimed at creating a flexible workforce have increased the use of temporary help and other types of employment services. In many cases, professional, scientific and technical services jobs have benefited from the outsourcing of non-core business functions, such as accounting, and increasing use of various types of consultants.
Education and health services, which grew by 21.6 percent overall and added 68,600 jobs, has four sectors with growth of more than 30 percent: private educational services (34.9 percent, 17,000 jobs); offices of physicians (32.6 percent, 11,600 jobs); social assistance (34.2 percent, 10,400 jobs); and the small but fast-growing medical and diagnostic labs (60.6 percent, 2,000 jobs). In addition, employment at Indiana's private/non-public hospitals grew 17.2 percent (15,100 jobs).
Leisure and hospitality employment expanded 12.2 percent over the decade, adding 30,500 workers to their payrolls. Arts, entertainment and recreation services added 9,000 workers (26.2 percent), with more than half of the increase (5,000 jobs) coming from gambling/gaming employment across the state. Food services employment growth was dominated by full-service restaurants, growing at 24.4 percent—almost four times the 6.2 percent rate of limited-service eating places—and adding 18,700 workers to their payrolls.
The Hoosier economy is rife with hot spots—sectors that have far outperformed the overall state, and often national, rate of growth. The evidence presented confirms that Indiana's economy continues to diversify and is resilient to economic downtowns in vulnerable sectors, such as manufacturing. These economic engines serve as Indiana's main vehicles for employment growth moving forward.
Notes
- Indiana Economic Development Corporation (IEDC) News Release, "Honda selects Indiana for new North American plant," 6/28/2006.
- IEDC News Release," Governor announces Toyota to add Camry line in Lafayette," 3/13/2006.
Vicki Seegert
Advanced Economic and Market Analysis, Indiana Department of Workforce Development