How Do Education, Age and Gender Relate?
Last month, we briefly overviewed the new educational attainment data from the 2005 American Community Survey (ACS). This month, we delve into educational attainment by age.
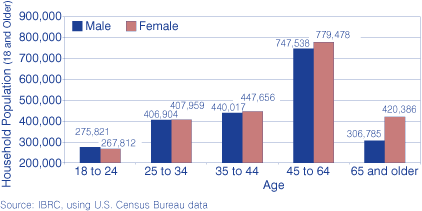
To view this data by age, it is first useful to know what Indiana's age distribution looks like (see Figure 1). Indiana's age breakdown closely mirrors the nation, with the 45 to 64 age group as the largest age cohort. The genders are roughly equal, with the exception of the oldest group: eighteen percent of Hoosier women age 18 or older are senior citizens (age 65 or older), compared to just 14 percent of Hoosier men. As mentioned with all ACS products, the survey is based on household population and does not include those living in group quarters. For example, for the youngest age group, students living in dormitories are not counted; for the oldest age group, senior citizens living in nursing homes are not included in these estimates.
Figure 1: Indiana's Age Distribution by Sex, 2005
In Indiana, 37 percent of the household population age 18 or older earned a high school diploma and did not pursue higher education (see Figure 2). Twenty-eight percent had some college experience or earned an associate's degree, while 20 percent received a bachelor's degree or higher. An additional 16 percent were not high school graduates. Figure 3 looks at the percentage of each age group that has attained each level of education.
Figure 2: Hoosier Education by Age, 2005
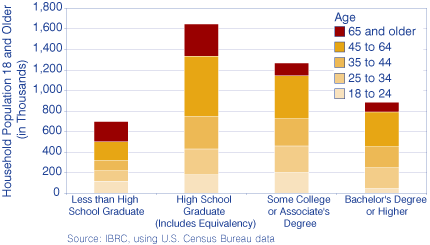
Figure 3: Percent of Age Group with Specified Educational Attainment, 2005
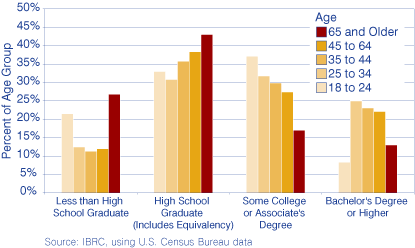
Less than High School Graduate: Not surprisingly, one finds that the oldest and youngest age groups have the highest percentages not completing high school. While 22 percent of those in the 18 to 24 age group do not have a diploma, that is most likely attributable to a fair number of the youngest of that cohort still attending high school. Meanwhile, the 27 percent of those over age 65 without a diploma can be explained by an era where a high school diploma was not mandatory for a good job. The age group with the lowest percentage falling in this category was the 35 to 44 group (11 percent).
High School Graduate or Equivalent: When looking at this indicator, one must realize that it is not all the high school graduates in an age group; rather it includes just those who earned a diploma (or GED) but did not go on to college. The 65 and over age group had the highest percentage (43 percent) in this category, mainly because fewer people in that generation attended college.
Some College or Associate's Degree: Whereas 37 percent of 18-to 24-year-olds have some college or an associate's degree, that number drops with each successive age group to a low of 17 percent for those 65 or older.
Bachelor's Degree or Higher: At just 8 percent of the age group, those under age 25 are the least likely to have a bachelor's degree or more—perhaps indicating that people are taking longer to get through college. In comparison, 25 percent of those between age 25 and 34 earned a bachelor's or advanced degree.
Nationwide Comparison
How does Indiana stack up against the nation? In both the nation and state, 16 percent of the population age 18 or older are not high school graduates. However, while 54 percent of those 18 or older have at least some college experience nationwide, that number falls to 48 percent in Indiana—a difference of 6 percentage points.
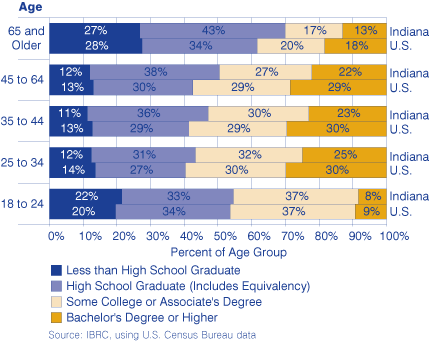
In fact, for each age group, Indiana had a smaller percentage with at least some college experience than the United States as a whole (see Figure 4). That gap was larger with the older age groups. For example, the gap was just 1 percentage point for the 18 to 24 age group, but was 8 percentage points for both the 45 to 64 age group and the 65 and older group. Thus, while Indiana's young adults have at least pursued higher education at about the same rate as their peers nationwide, it is the middle-aged and older Hoosiers who are less likely than their U.S. peers to have attended college. However, looking only at the completion of a bachelor's degree or higher, Indiana lags the nation by 5 to 6 percentage points for all age groups (with the exception of those under 25, where the gap is just 1 percentage point).
Figure 4: Educational Comparison by Age in Indiana and the United States, 2005
Breakdown by Gender
Looking at higher education for Indiana's total population age 18 or older, women account for 54 percent of all those with some college or an associate's degree. For a bachelor's degree or higher, it is a 50-50 split between the genders. However, the picture is much more interesting when breaking these data down by age groups (see Table 1).
Table 1: Gender Breakdown of Education by Age, 2005
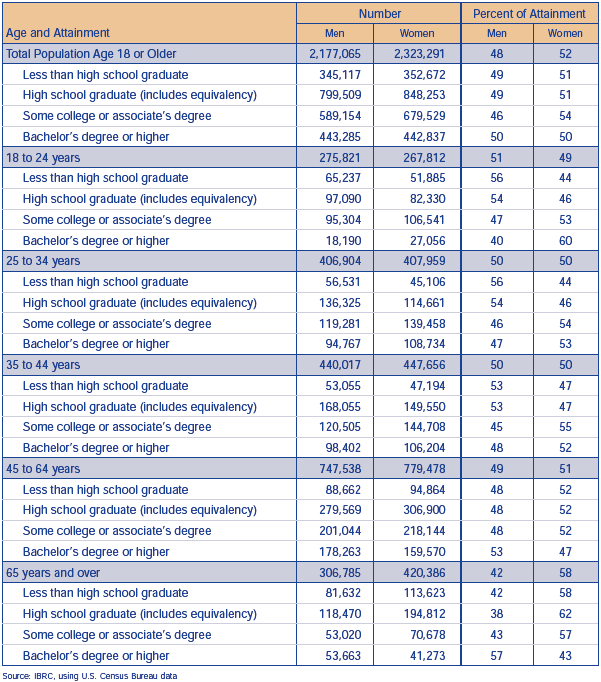
Bachelor's Degree or Higher: Women tend to be more educated than their male counterparts in three of the five age classifications. It is only for those age 45 or older that men account for a higher proportion of those with a bachelor's or advanced degree than women. For those over 65, it is not all that surprising, given the societal norms of the time, to find men holding 57 percent of the bachelor's and advanced degrees even though they only make up 42 percent of that age group.
However, for the youngest age group (those under 25), 60 percent of those with a bachelor's degree or higher are women. For the 25 to 34 age group, women make up 53 percent of the bachelor's or advanced degree category.
Adding it all up, there are 241,994 Hoosier women younger than 45 with a bachelor's degree or higher, compared to just 211,359 men—a difference exceeding 30,600.
Less than High School Graduate: At the other end of the spectrum, a higher percentage of young men have less than a high school degree than is the case for young women. For those between 18 and 24, men accounted for 56 percent of the roughly 117,100 individuals in that age group who did not graduate from high school. Of course, part of that disparity may trace back to “academic redshirting,” with boys starting kindergarten somewhat later than girls and thus being a little older at high school graduation. However, the numbers are the same in the 25 to 34 age group, with men accounting for 56 percent of those not graduating from high school or obtaining a GED.
Nationwide, much has been written about how boys are falling behind girls academically. Here in Indiana, these data seem to support that notion, indicating that Hoosier women in the younger age categories are more likely to have achieved academic success than their male counterparts.
Rachel Justis, Managing Editor
Indiana
Business Research Center, Kelley School of Business, Indiana University