Baltic States Part III: Estonia
Estonia is the smallest of the three Baltic nations and the focus of our final piece in the series. It is located north of Latvia, south of Finland, west of Russia, with Sweden across the Baltic Sea. Estonia shares the same history as other Baltic States regarding its occupation by the Soviet Union, its independence in 1991, and accession to the European Union (EU) and NATO. Nevertheless, the Estonian economy is quite different from Lithuania and Latvia.
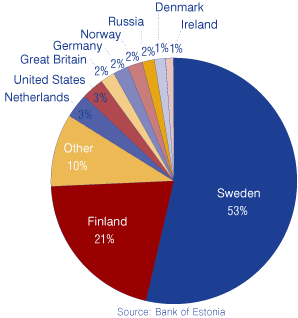
Like the other Baltic States, Estonia is experiencing a steep rise in foreign direct investment. Based on fourth quarter data for 2005, foreign direct investment in Estonia grew 26.4 percent from the same quarter of the previous year, and it has risen an astounding 303 percent since the fourth quarter of 2001 (see Figure 1). For such a small country, one of the key factors in its success is its location. Finland remains Estonia's closest neighbor and one of its strongest partners, and has contributed slightly more than 20 percent of the total investment. However, the clear investment leader for Estonia has been Sweden, accounting for 53 percent of the total investment. The United States remained among the top 10 foreign investors along with the Netherlands, Great Britain, Germany, Norway, Russia and Denmark (see Figure 2).
Figure 1: Foreign Direct Investment in Estonia, December 31st of Each Year
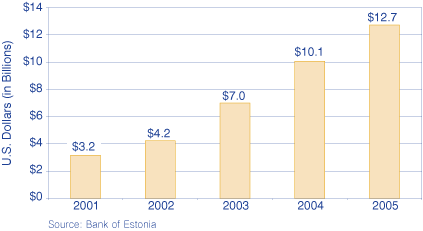
Figure 2: Main Countries Investing in Estonia, 2005
Estonia is among the leaders in the region regarding outbound foreign direct investment per capita. During 2005, the biggest portions of the investment flow went to Lithuania (31.1 percent), Latvia (29.5 percent) and Russia (14.8 percent). However, one must bear in mind that the majority of investments are done by the foreign investors operating in Estonia and seeking further expansion in the region.
The main reasons foreign investment inside Estonia is growing include low production costs, a comparatively cheap, high-quality workforce, the growing buying capacity of Estonians, as well as close proximity to neighboring states. The Estonian labor force slightly differs from the other Baltic States. Estonia has a high percentage of knowledge-intensive jobs (30.9 percent of all jobs). In comparison, Lithuania (24.7 percent), Latvia (24.7 percent) and other Eastern and Central European countries (Hungary, Slovak Republic, Czech Republic, Slovenia and Bulgaria) have fewer highly skilled jobs.
Foreign investors are primarily investing in Estonia's financial intermediation (45.7 percent), real estate (15.2 percent) and manufacturing (13.3 percent) sectors. The largest banks in Estonia are owned by Swedish and Finnish investors. Foreign investors also tend to invest in telecommunications, transportation and service industries.
One example of the existing potential in Estonia involves the Scandinavian- and Estonian-owned company Skype, which successfully marketed Internet calls (that is, Voice Over Internet Protocol). In 2005, the company was bought by eBay for about $2.5 billion.
Among the top 50 foreign companies in Estonia in 2006, four are accredited to the United States. The highest ranked American company is Baltic Rail Services (at sixth place with 32 million euros of investment). It is owned by the Dutch and U.S. companies EEIF Rail/Rail World Estonia. The other three companies accounted for by the United States are Horizon Tselluloosi ja Paberi (13th), Fiesta Real Estate (22nd) and McDonald's (45th).
Estonian Trade
The Scandinavian states are Estonia's best trading partners, especially Finland. In addition, those in Finland heavily travel to Estonia, purchasing services and goods—especially alcohol and tobacco. After Estonia joined the EU, taxes for tobacco and alcohol were abolished. This served as an incentive for Finnish tourists to travel to Estonia and aided in making them the biggest group of hotel and dining service purchasers while contributing to local trade.
The small size of Estonia limits its ability to produce all the goods needed to become self-sufficient. In addition, during the Soviet period, there were a limited number of Estonian industries and all other needed goods were supplied by the various Soviet Union countries. These are two reasons why Estonia imports more than it exports.
During 2005, however, Estonian exports went up 30 percent. The main export commodities are machinery and equipment, wood and paper, textiles, food products, furniture, metals, and chemical products.
As mentioned before, Estonia's main export partners include Finland (27 percent), Sweden (13 percent) and Latvia (9 percent). The United States accounts for 3 percent of Estonian exports and Estonia's exports to the United States have steadily risen since 2000 (see Figure 3).
Figure 3: Exports to the United States from Estonia, 2000 to 2005
The main Estonian goods exported to the United States during 2005 were chemical products, textile and textile products, wood and wood products, mineral fuels, mineral oils and their products, and prepared foodstuffs and drinks.
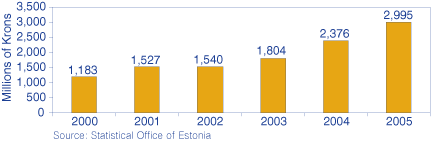
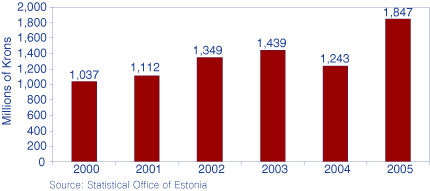
During 2005, Estonian imports increased by 22 percent (see Figure 4). The main articles imported to Estonia from the United States were machinery and equipment, means of transport, metals and metal products, and chemical products. Estonia had a positive trade balance with the United States for 2005.
Figure 4: Estonia's Imports from the United States, 2000 to 2005
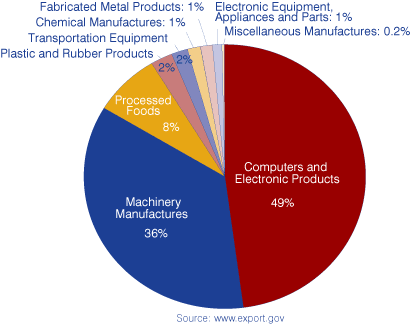
Unfortunately, we cannot track the imports to Indiana due to the many possible places of entry. Nevertheless, we can analyze the exports from Indiana to Estonia. Indiana's exports to the country during 2005 more than doubled compared to previous years, increasing by 185 percent (see Figure 5). Indiana ranked 23rd among states exporting to Estonia. Virtually half of all Hoosier products exported to Estonia were computers and electronic products, followed by machinery at 39 percent and processed foods at 8 percent (see Figure 6).
Figure 5: Growing Trend: Exports from Indiana to Estonia, 2000 to 2005
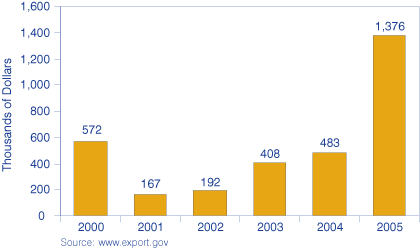
Figure 6: Indiana's Exports to Estonia, 2005
Notes
- Bank of Estonia, www.eestipank.ee/en. For more data, visit www.eestipank.ee/en/press/statistical-release/2021
- Estonica, www.estonica.org/en/
- Companies with Major Foreign Shareholdings in 2006, available online at
www.investinestonia.com/