Health Insurance Costs and Coverage
Health care costs and coverage is always a hot topic and is becoming of increasing interest to the public as they find themselves shouldering more of the costs. The Census Bureau has three program areas that examine health insurance coverage in the nation (all three survey individuals only).
- Current Population Survey (CPS): national and some state data
- Survey of Income and Program Participation: national data only
- Small Area Health Insurance Estimates Program: estimates for all the counties in the nation for 2000.
In addition to the programs at the Census Bureau, several private foundations and other government agencies track health care statistics from both the individual and employer perspectives. The following are some comparisons of the data that are available.
Current Population Survey
The CPS recently released the 2004 report for the nation. It found the number of people with health insurance coverage increased from 2003 to 2004, but so did the number of people without health insurance—an increase of 860,000 Americans (or 1.9 percent) comprising 15.7 percent of the population. (1)
Regionally, the Midwest was the only region to have a decline in the number of uninsured residents while the South had the largest increase in the number of uninsured (641,000 people or 3.4 percent). The age group 25 to 34 years old showed the largest decline in the number of uninsured and children under 18 also showed a decline (105,000 or 1.3 percent). The middle-class, with a household income of $50,000 to $74,999, had the largest increase in the number of uninsured (616,000 or 8.5 percent). However, the percentage of the population uninsured declines as incomes rise, so even though the middle-class’s position on this measure has deteriorated, they still fare much better than individuals making less than $25,000—almost a quarter of that population is without health insurance.
Small Area Health Insurance Estimates
Regionally, the West and South had a greater percentage of their population without health insurance coverage in 2000 (see Figure 1). In Indiana, the percentage of residents without coverage was lower than the national average for total population and children under 18.
Figure 1: Percent of Total Population without Health Insurance, 2000
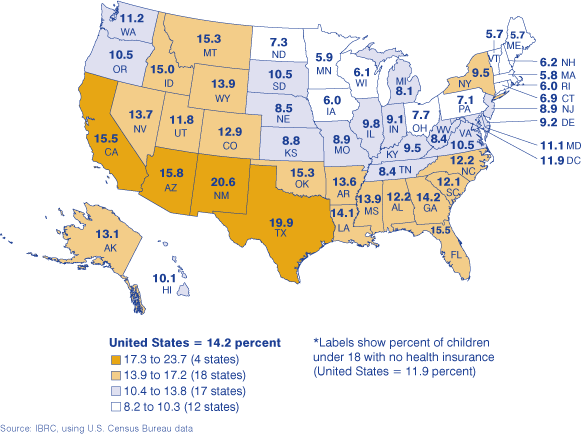
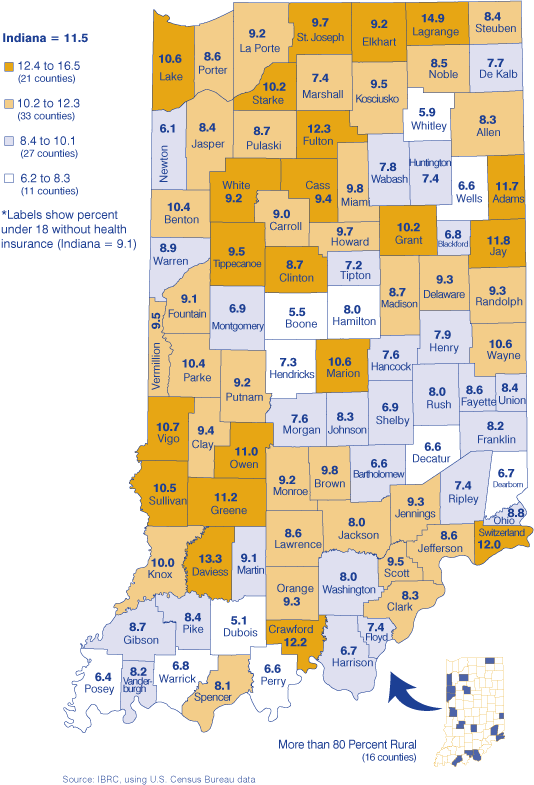
Figure 2 shows a connection between where you live in the state and health care coverage; in general, rural counties have a higher percentage of their population without health insurance. Lagrange County, which is more than 80 percent rural, had the greatest percent of its population without health coverage for all ages and children under 18. Boone County showed the best results with only 6.2 percent of its population without health insurance and Dubois had the best results for health insurance coverage for children under 18—almost 95 percent of its children are covered. To learn more about the Small Area Health Insurance Estimates program and how these estimates are produced, visit www.census.gov/programs-surveys/sahie.html.
Figure 2: Percent of Total Population without Health Insurance, 2000
Employer Health Benefits Survey
The Henry J. Kaiser Family Foundation has 50 states’ health insurance coverage and cost data available. (2) Also, the foundation conducts an annual national survey of private and public employers with three or more workers. The most current Employer Health Benefits survey for 2004 found that health insurance premiums in the nation have moderated over the last year but continue to grow at double-digit rates (11.2 percent). Meanwhile, 52 percent of large firms (200 employees or more) and 15 percent of small firms responded that they were very likely to increase the amount their employees pay for health insurance over the next year.
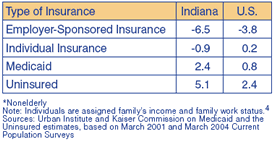
From 2002 to 2003, 61 percent of Indiana’s population was covered by some form of employer-sponsored plan, 7 percentage points higher than the U.S. average. However, employer-sponsored health coverage for adults age 19 to 64 in Indiana has fallen by 6.5 percentage points between 2000 and 2003, a considerably larger decline than in the nation (see Table 1).(3) Just over 59 percent of private sector establishments in Indiana offered health insurance in 2002, slightly higher than the U.S. average. Of those private sector establishments, 97.6 percent of the firms with 50 or more employees offered health coverage while only 44.2 percent of firms with fewer than 50 employees offered coverage, 0.3 percentage points less than the national average. Perhaps we could improve our uninsured percentage by offering a state COBRA expansion program, which would extend coverage to employees in firms with fewer than 20 workers. Currently, 38 other states have COBRA expansion programs.
Table 1: Percentage Point Change*
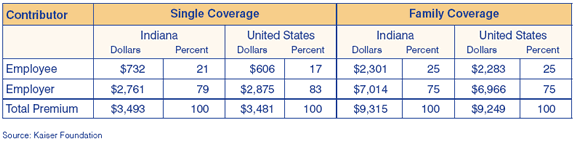
In 2003, Indiana employers contributed 75 percent to insurance premiums for family coverage and was slightly higher nominally than the nation. On a percentage basis, Indiana ranked 19th among the states in employer contributions to family coverage premiums, 6.3 percentage points less than the previous year.
Indiana’s employee contributions to family coverage premiums increased by $765 from 2002, which is closer to the nation in terms of employee versus employer contribution percentages. Employees with single coverage did not fair as well in the Hoosier state, contributing more in annual premiums than the national average and ranking eighth on a percentage basis among the 50 states (see Table 2).
Table 2: Average Annual Cost of Employment-Based Health Insurance, 2003
Behavior Risk Factor Surveillance System
Indiana participates in the Behavior Risk Factor Surveillance System (BRFSS) survey. The Indiana State Department of Health, in partnership with a variety of public and private programs, is responsible for planning, implementing, evaluating and tracking disease and injury prevention programs in the state. The ultimate goal of the national BRFSS survey is to provide valid data to assist in these tasks. The most recent report for 2002 (published in April 2004) is similar to the CPS report. Indiana’s sample size for 2002 was 5,789 randomly selected Indiana residents age 18 years or older.
When Hoosiers were asked about health care coverage, 27.1 percent of residents age 18 to 24 reported no health care coverage, whereas 5.7 percent of Hoosiers age 65 and older reported being uninsured. Similarly, the CPS report on the nation found the 18 to 24 age group to have the highest uninsured percentages and the population 65 and older to have the lowest. Also, the BRFSS survey found that Hoosier males were more likely to be uninsured than females, and 35.4 of Hispanics in Indiana are without coverage. The survey found that a definite correlation between income, education and health coverage exists: As income goes up and more degrees are accumulated, health coverage becomes more likely.(5)
Notes
- The report in its entirety can be viewed at www.census.gov/prod/2005pubs/p60-229.pdf
- The Kaiser Family website: www.statehealthfacts.org
- The percentage change in people by coverage type between 2000 and 2003 is statistically significant at the .10 level. Source: Kaiser Family Foundation
- Family is defined here in terms of “health insurance units”—i.e., groups of related persons whose combined income would be counted in determining Medicaid eligibility in most states, which is similar to persons who would be able to jointly purchase private insurance. For more detail on coverage groups, see “Methodology” at www.statehealthfacts.org/about.jsp.
- The BRFSS survey can be found at www.in.gov/isdh/dataandstats/brfss/2002/toc.htm
Amber Kostelac, Data Manager
Indiana Business Research Center, Kelley School of
Business, Indiana University