Fewer Millionaires and a Larger Middle-Class: Tax Returns from 2003
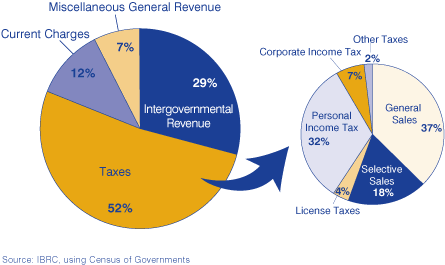
According to the Census of Governments, 52 percent ($11.2 billion) of the money coming into the state government’s coffers was from taxes. The other half of the state’s general revenue came in the form of intergovernmental revenue, current charges and miscellaneous revenue. (1) Indiana’s largest sources of state government revenue (55.5 percent) are general and selective sales taxes, contributing a collective $6.2 billion. The personal income tax is the state government’s next largest revenue stream, contributing $3.6 billion or 32.5 percent (see Figure 1).
Figure 1: State Government Finances, 2003
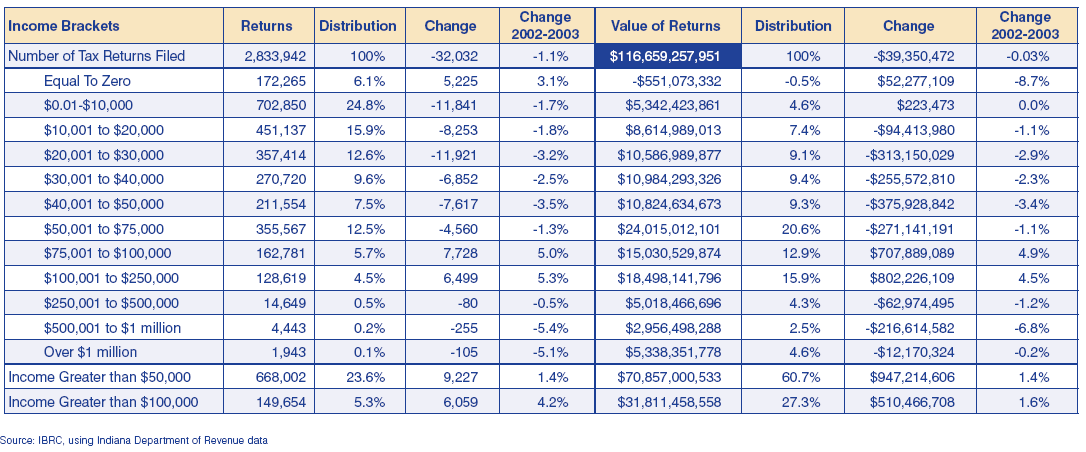
For the 2003 tax year (payable in 2004), 2.83 million personal income tax returns were filed, a 1.1 percent decline (32,032 returns) since 2002. (This includes all filing types and out-of-state taxpayers who owed Indiana taxes.) Over the same time period, the population increased by 0.7 percent (41,244).
Returns for taxpayers in the $20,001 to $30,000 income bracket declined the most, and the largest increase was for taxpayers in the $75,001 to $100,000 income tax bracket. There were 105 fewer returns reporting over $1 million in income and an increase of 5,225 returns reporting no income in 2003. Total federal adjusted gross income (AGI) for Indiana taxpayers and those non-resident filers was $116.6 billion, slightly down from the previous year (see Table 1). AGI is the sum of all taxable sources of income (capital gains, dividends, pension and annuity income), less any adjustments allowed.
Table 1: Indiana Income Tax Returns, 2003 Payable 2004
Marion and Lake county residents filed one-fifth of the state’s tax returns and had a fifth of the state’s total federal AGI. However, both Allen (6.1 percent) and Hamilton (6.5 percent) counties paid a larger share of income taxes than Lake County. (2)
The average AGI for all filing types increased by 1.1 percent to $41,165 over the year. This increase did not keep pace with inflation, which was 2.3 percent for the same time period. Figure 2 is a good depiction of where wealth is located in the state, which not surprisingly encompasses the major metro areas. The most notable increase is the average value per return in Daviess County (17.3 percent), where 121 fewer returns were filed but the cumulative value of those returns rose by $65 million.
Figure 2: Average Adjusted Gross Income 2003

Click for larger image with county names
Figure 3 looks at the median AGI. When there are some tax returns with very high incomes, the median is a closer measure of the “typical” taxpayer. (3)
Figure 3: Median Adjusted Gross Income, 2003

Click for larger image with county names
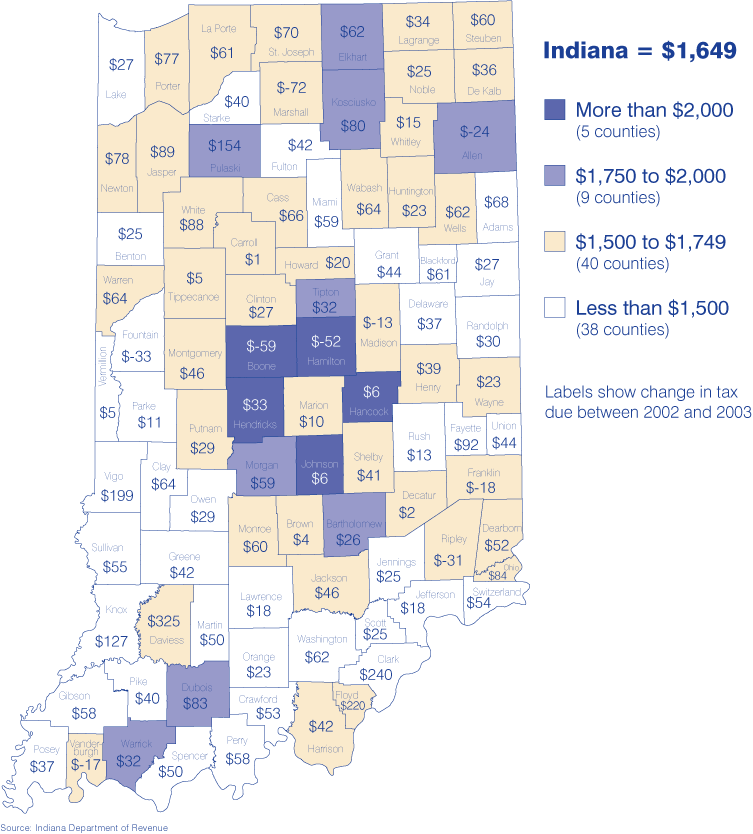
Figure 4 looks at the average tax due per return before withholding and credits are figured into the equation. (Note: Only returns with tax liability were used as a base for this calculation.) As we might expect, the counties with the highest average adjusted gross incomes also had the largest income tax liability. Hamilton County led the state with an average tax of $3,285 per return. However, this has dropped $52 since 2002.
Figure 4: Average Tax Due Per Return, 2003
Click for larger image with county names
The income tax—just another piece of the economic puzzle but certainly an avenue that should be explored.
Notes
- Intergovernmental revenue comprises monies from other governments, including grants, shared taxes, and contingent loans and advances for support or reimbursement of particular functions or for general financial support. Current charges are those imposed for providing current services or for the sale of products in connection with general government activities. Miscellaneous revenue comprises all other general revenue of governments from their own sources (other than liquor store, utility and insurance trust revenue).
- For percent of state calculations, out-of-state taxpayers were removed from the state total. Incidentally, those out-of-state residents filed 122,000 returns and contributed $3.4 billion to Indiana’s total federal AGI.
- This figure is not the same as the median household income reported by the Census Bureau; this figure represents the adjusted gross income that is higher than half of the incomes reported on individual income tax returns.
By Amber Kostelac, Data Manager
Indiana Business Research Center, Kelley School of Business, Indiana
University