Population Estimates for 2004: Indiana Barely Maintains Its Rank
Indiana’s population reached 6.24 million on July 1, 2004, according to the Census Bureau’s recently released state population estimates. Our gain since 2003 was about 38,000, for a growth rate of 0.6 percent. The growth since Census 2000 was approximately 157,000, yielding a 2.6 percent increase for the period.
Washington Is Nipping at Our Heels
Indiana is just barely hanging on to its status as the 14th most populated state in the nation, as the state of Washington is poised to eclipse us within the next year or so. The difference in population between these two states has decreased fairly rapidly in recent years, the gap closing from 186,000 in April 2000 to only 34,000 this past summer. If these states experience the same annual rate of growth from 2004 to 2005 as was observed between April 2000 and July 2004, Washington’s population will exceed Indiana’s by nearly 3,900 in July 2005 (assuming constant growth).
Gaining on Massachusetts
Both Indiana and Washington are gaining on Massachusetts, currently the 13th largest state. The population gap between Indiana and Massachusetts has decreased from about 269,000 for the 2000 census to only 179,000 in 2004. Washington is gaining on Massachusetts even more quickly, closing the gap from about 455,000 in 2000 to only 213,000 in 2004. Another hard-charging state, Arizona, narrowed the margin with Massachusetts from over 1.2 million for Census 2000 to roughly 673,000 by 2004. Helping to close these gaps is the fact that Massachusetts sustained a population loss of about 3,850 between 2003 and 2004.
High Growth States
To determine a state’s growth, we can focus on numeric change, percent change or both simultaneously. Figure 1 shows the percent change from April 2000 to July 2004 plotted against the numeric change for the same period. Due to the arithmetic involved, states with large populations are more challenged to achieve high percent increases than states with small populations. The scatterplot gives us a comprehensive visualization of the population growth that has taken place.
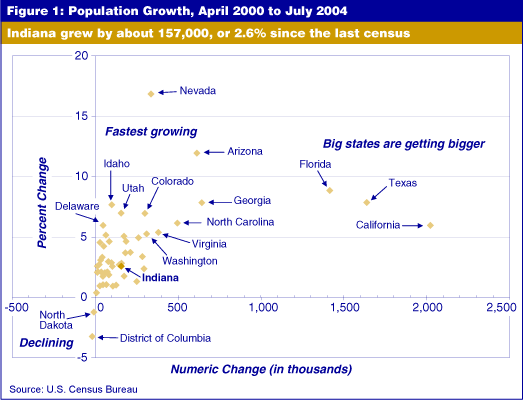
The points that are furthest away from the scatterplot’s “center of mass” have been labeled, and these represent the states at the extremes of population change so far this decade. Nevada and Arizona lead the nation in terms of percent change, while California, Texas and Florida have taken the biggest gains in terms of absolute numbers. North Dakota and the District of Columbia are the bottom feeders, as they alone sustained population losses from April 2000 to July 2004.
So What Might Happen by 2010?
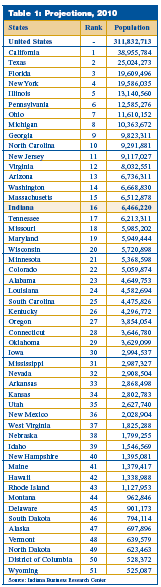
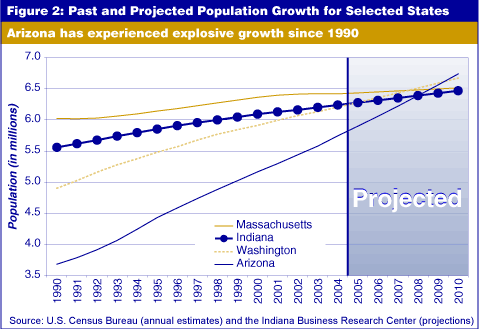
If we assume the population growth observed for each state since April 2000 will continue at the same rate throughout the rest of the decade, we can use the mean annualized growth rate to predict future population change (see Table 1). (1) This rudimentary projection method assumes constant growth. According to these projections, Indiana’s rank will fall to 16th by the summer of 2010, and Massachusetts will fall to 15th; however, Indiana’s population will be within 47,000 of Massachusetts’. On the other hand, Washington surges past both Indiana and Massachusetts to overtake 14th place, while Arizona’s explosive growth will lead it to surpass all three of these states, plus Tennessee and Missouri, to become lucky number 13 (see Figure 2). Another fast-growing state is Nevada, which will bypass Arkansas, Kansas and Utah to advance from 35th to 32nd. Other predictions for 2010: Florida will edge out New York for third place, North Carolina will claim 10th place from New Jersey, Connecticut takes the 28th spot from Oklahoma, New Hampshire gets past Maine to take 40th place and Vermont displaces North Dakota at number 48. (2)
Using the same projection technique for the United States, we predict the national population will reach about 312 million by summer 2010. This figure is a little higher than the Census Bureau’s projection of 309 million, which was generated by using a more complicated projection technique called the cohort component method. The Census Bureau is slated to release new state-level population projections sometime in 2005, which will also be produced via the cohort component technique. The IBRC produced population projections for Indiana and all 92 counties through 2040 using that same methodology. They were released in July 2003 and are available on STATS Indiana at www.stats.indiana.edu/pop_proj/.
Notes
- The state-level projections are not controlled to the national projection. The difference between the sum of the states and the national projection is 427,217 or 0.1 percent.
- An excel file containing IBRC-calculated population projections through 2010 for the nation, states, District of Columbia and Puerto Rico is available at www.stats.indiana.edu/projections_topic_page.html.
Vincent Thompson
Economic Analyst, Indiana Business Research Center,
Kelley School of Business, Indiana University