Indiana Incomes Rise But Share Declines
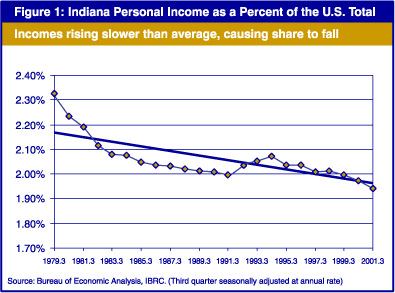
Measured in dollars, total personal income in Indiana has been expanding steadily for many years, according to data released recently by the U.S. Bureau of Economic Analysis. It usually grows at a slower rate than the national average though, so Indiana's percent share has been declining gradually (see Figure 1).
Personal income is the sum of wages people earn from work, plus earnings from dividends, interest and rent, plus transfer payments such as unemployment insurance. BEA issues state estimates every quarter, expressed as a seasonally adjusted annual rate.
By this measure, Indiana's total personal income came in at $170.2 billion for the third quarter of 2001. It rose at a 3% rate between third quarter 2000 and 2001, while the United States increased by 4.6%. Because of this slower growth rate, Indiana's share of total U.S. personal income slipped from 1.97% in the prior year to 1.94% in third quarter 2001.
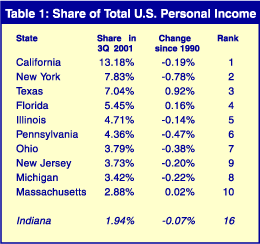
Over the past decade, personal income in Indiana has grown at an average annual rate of 5.04% with the best years of growth occurring in the early 1990s. The average annual growth rate for the nation as a whole was 5.36% for the same time period. The net decrease in Indiana's share of total U.S. personal income since 1990 is .07 percentage points. This loss of ground, however, was not enough to alter our rank as the 16th largest contributor to U.S. total income. Interestingly, seven of the top ten largest contributing states saw greater declines in share than Indiana while also maintaining their rank (see Table 1).
Nevada, Colorado, Arizona, Utah and Georgia were the five states with the highest annual growth rates for personal income since 1990. Nevada showed the most dramatic personal income growth with an annual rate 3.2% higher than the national average (8.59% versus 5.36%). At this pace, Nevada's share of total U.S. income grew by .21 percentage points and its rank increased five spots, from 37 to 32.
Unfortunately, since the end of the 1991 recession, the Great Lakes region has had the slowest rate of personal income growth, according to BEA's regional numbers (see Figure 2).
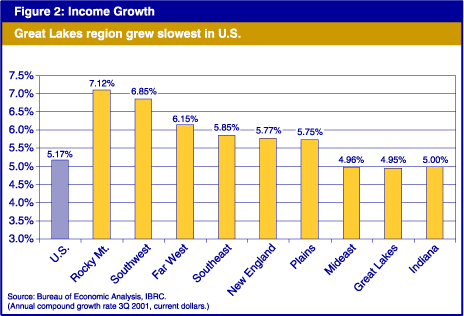
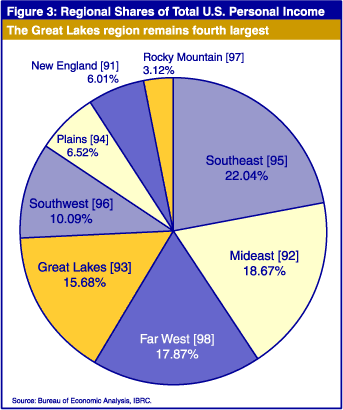
Included in the Great Lakes region are Illinois, Indiana, Michigan, Ohio and Wisconsin. In this eight-year period, personal income increased in the Great Lakes region by an average of 4.95% per year, without any adjustment for inflation. Nationwide the average annual rate was 5.71%. Indiana was in the middle of the Great Lakes pack, posting a 5.0% annual increase. That was higher than Michigan or Ohio, but slightly below Illinois and Wisconsin. While the Rocky Mountain Region has grown the fastest, it still contributes the smallest share to U.S. total personal income. The Great Lakes region remains the 4th largest in terms of U.S. shares (see Figure 3).
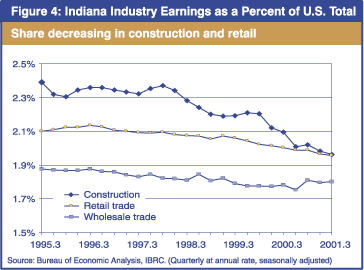
For further insight into total personal income, let's look at the major sectors of Indiana's economy during the last six years. During these boom years, earnings in Indiana from construction, retail trade and wholesale trade all shrank as a percent of the nation, though wholesale trade didn't lose very much (see Figure 4).
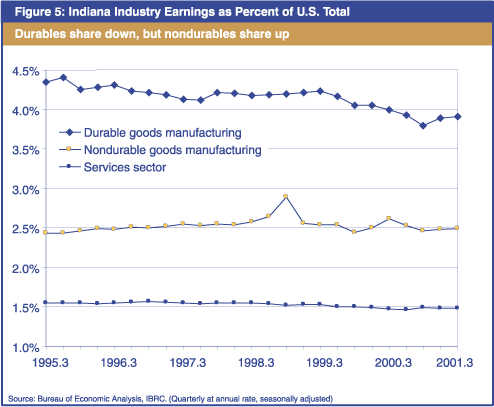
Indiana's share of earnings from durable goods manufacturing contracted from nearly 4.5% of the U.S. total to less than 4% (see Figure 5). Even the services sector, the fastest growing part of Indiana's economy, was off slightly as a percent of the nation. The bright spot came in non-durable goods manufacturing. Here Indiana's share gained slightly. Indiana's pharmaceutical, chemical and rubber products industries helped the state capture 2.5% of the nation's income from these industries.
Hoosier incomes continue to rise, and that's good news. Around half of the other fifty states, though, are rising faster. Indiana's weak year-to-year growth towards the end of the 1990s has not helped. But the success of our non-durable goods sector may be pointing the way to opportunities for more prosperity in the future. To truly understand Indiana's progress and relative position in terms of income, however, one must look at annual data on per capita income and per capita disposable income, adjusted for inflation. These data are issued annually in September.