Measuring the Growth Momentum of Employment in Indiana
What are the high employment growth industries in Indiana? This is a frequently asked question that does not have a simple answer. Let's explore different employment growth measures in an attempt to identify high-employment-growth industries using Covered Employment and Wage data for first quarter 2000 and first quarter 1995. Data for some industries have been suppressed due to disclosure restrictions, resulting in a list of 316 industry sectors at the three-digit SIC level.
Two common measures of employment growth are change in employment and percent change in employment. Change in employment tends to overlook significant growth in smaller industries, while percent change can overemphasize very rapid growth in extremely small industries. For example, employment in the fastest-growing telegraph and other message communications sector grew by 450% between 1995 and 2000, but this sector still employs less than 100 people in the state.
An alternative measure to identify high-growth industries that eliminates the smallest industries from consideration is the change in an industry's share of the state's employment. In order to attain a high ranking on change in share, an industry must satisfy two criteria: a fast rate of growth, and large enough in employment size so that its growth results in a noticeable change in the industry's share of statewide employment. In the case of the telegraph and other message communications industry, which grew by 450% over five years, only the growth rate criterion is satisfied. Even in 2000, after experiencing rapid growth, the industry's employment size of fewer than 100 workers leaves this sector with a microscopically small change in its share of total state employment.
However, a drawback to this measure is its treatment of the state's largest industry sectors that are growing, but not as rapidly as the average state growth. For instance, if a very large industry has a growth rate that matches the state average, the industry's change in share is zero. Furthermore, if a large industry's growth rate is slightly below the state average, the industry will show a decline in its share of the state's employment. Between 1995 and 2000, the state's largest sector, Eating and Drinking Places, grew by almost 14,000 in employment, ranking as the state's fourth largest in numeric growth. However the sector's growth rate of 7.5% was below the state average 8.7%, resulting in a decline in share. In fact, the sector ranked 298th out of 316 industries, despite healthy growth in an already large sector.

Is there a measure that incorporates both numeric growth and the growth rate? In physics, momentum of an object is calculated as the mass of the object times its velocity. A fast-moving small object and a larger but more slowly moving object might have the same momentum. If two objects have the same mass, then the one that is moving faster will have the larger momentum. Similarly, if two objects are moving at the same speed, then the object with more mass will have the larger momentum.
Let's put together a simple measure of employment growth momentum by multiplying the change in employment for an industry (similar to mass) by the growth rate for that industry (similar to velocity). The result is an attempt to quantify employment growth in industry sectors, using both numeric growth amounts and growth rates. For industry sectors experiencing decline in employment, the momentum is multiplied by negative one, resulting in negative values of momentum for these sectors.
Table 1 illustrates employment for first quarter 2000, change and percent change in employment between 1995 and 2000, and the growth momentum measure for a subset of industry sectors. The subset of sectors includes any industry that ranks in the top 10 in employment, change, percent change, change in share or growth momentum.
The result is a list of industry sectors that includes large amounts of employment, large numeric growth, high percent growth, large increases in share of the state's employment and high momentum. This allows us to compare the various growth measures and subsequent rankings for these highest-ranking industry sectors. Table 2 contains the rankings for each growth measure for these industries. The industry sectors are listed in descending order of momentum in both tables.
The top 10 sectors in terms of momentum have numeric employment growth figures that range from 1,400 (cash grains) to almost 20,000 (personnel supply services). Employment growth rates range from 12% (elementary and secondary schools) to 258% (administration of general economic programs). Examples of the types of establishments found in each of the top 10 momentum sectors can be found in Table 3.
Picture each industry sector as a snowball, growing as it rolls down a hill. The sectors that are experiencing the largest amounts of numeric growth in employment are the ones that are adding the most snow. The sectors with the largest growth rates are moving the fastest. Figure 1 is a scatterplot that shows numeric growth and percent change in employment between 1995 and 2000 for each of the top 10 momentum sectors.
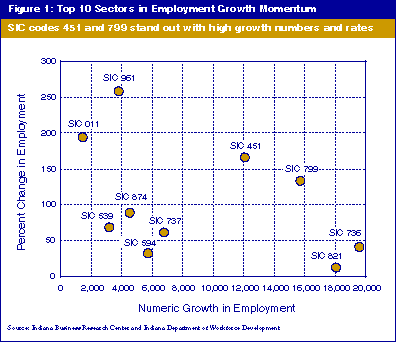
Faster-moving sectors that are adding larger numbers of employees are miscellaneous amusement and recreation services, and air transportation, scheduled, and air courier services. These are the two sectors that are rolling quickly (growth rate more than 100%) and adding large amounts of snow (more than 10,000 employees).
Fastest-moving sectors that are adding fewer employees are administration of general economic programs and cash grains. These are the two snowballs that are moving very quickly but not adding as much snow as the sectors above (less than 10,000 employees).
Sectors that are adding the largest numbers of employees but are moving more slowly are personnel supply services, and elementary and secondary schools. Sectors that are adding smaller numbers (less than 10,000 employees) and moving more slowly (growth rate less than 100%) are computer, data processing and other computer-related services; miscellaneous shopping goods stores; management and public relations services; and miscellaneous general merchandise stores.
It is important to note that terms such as "more slowly" and "smaller numbers" are relative. These 10 industry sectors are those with the highest employment growth momentum measures in the state economy. Each of these industries is growing faster than the state average of 8.7% between 1995 and 2000, and each industry added a large number of new employees