People, Jobs and Money: A Snapshot of the Indianapolis MSA
The Indianapolis metro area is made up of nine counties with very different economic structures. The nine Indiana counties that comprise the Indianapolis metropolitan statistical area (MSA) are Boone, Hamilton, Madison, Hendricks, Marion, Hancock, Morgan, Johnson and Shelby counties.
The most current population estimates from the U.S. Bureau of the Census show that on July 1, 1998, the Indianapolis MSA accounted for 26% of the state's population. Looking at covered employment and wage data (data based on place of work, not residence) for third quarter 1998 shows that the MSA accounted for 29% of the state's employment and 32% of the wages paid in the state.
Marion County held more than half of the MSA's population (54%), accounted for 71% of the MSA's employment and 75% of the wages paid in the MSA in third quarter 1998. Not surprisingly, this indicates that while Marion County is indeed a center of population in the MSA and the state, it has an even higher concentration of employment (see Figure 1).
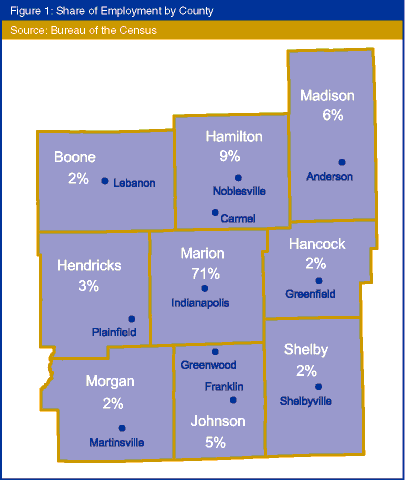
Employment and wages in the eight counties that surround Marion County were led by Hamilton County, Marion County's neighbor to the north, with employment of 70,500 followed by Madison (45,900), Johnson (37,800) and Hendricks (26,200) counties. The remaining counties in the MSA each recorded employment between 14,000 and 17,000.
These eight suburban counties have larger shares of the MSA's population than of its employment or wages. Morgan County's share of the MSA's population was twice its share of the MSA's employment.
Average quarterly wages paid in third quarter 1998 were highest in Marion County ($8,263) and Hamilton County ($7,850), both well above the state figure of $7,038. Average quarterly wages were lowest in Johnson County ($5,691), where the county's portion of employment in retail trade is high.
Economic Structure: Notable Features in Each County
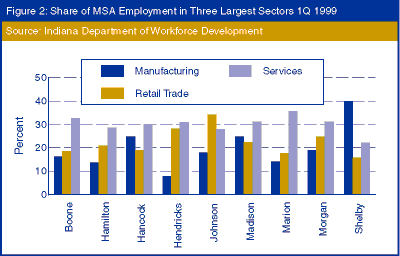
Three industry sectors together accounted for almost three-fourths of the employment in the state in first quarter 1999. These dominant industries were services (31%), manufacturing (24%) and retail trade (19%).
Figure 2 shows the contributions to total employment by these three industries for each county in the Indianapolis MSA in first quarter 1999. Some notable features of the composition of employment in each county include:
- Boone County : The manufacturing industry's share of employment in Boone County was lower than for the state, while the construction industry's share of employment was higher than for the state.
- Hamilton County: The finance, insurance, real estate sector's share of employment in Hamilton County was the highest in the MSA (16%), while the manufacturing industry's share was lower than for the state.
- Hancock County: The three industries that comprised the majority of employment in Hancock County, along with their shares of employment were almost identical to the state: services (30%), manufacturing (25%) and retail trade (19%).
- Hendricks County: Retail trade's share of employment was high (28%) while manufacturing's share was lowest in the MSA (8%).
- Johnson County: Retail trade's share of employment was the highest in the MSA (34%).
- Madison County: Similar to the state, with average wages ($7,252) closest to the state's average wage of $7,406.
- Marion County: The service sector's share of the employment in the county was highest in the MSA, 36%.
- Morgan County: The service sector's share was the same as for the state (31%), but unlike the state, employment in retail trade exceeded employment in manufacturing.
- Shelby County: Manufacturing's share of employment was highest in the state (40%), while the service sector's share of employment was lowest in the state (22%).
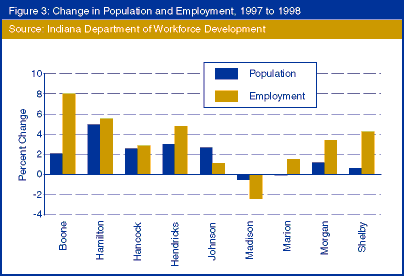
Population and Employment: Percent Change from Third Quarter 1997 to Third Quarter 1998
Six of the nine counties in the Indianapolis MSA experienced positive growth rates in both employment and population with growth rates for employment exceeding population growth rates during the same period: Boone, Hamilton, Hancock, Hendricks, Morgan and Shelby counties. In Boone County, the employment growth rate was four times the population growth rate, while in Shelby County the employment growth rate was seven times the population growth rate.
Johnson County grew in both population and employment, but with a population growth rate more than twice the employment growth rate.
Madison County experienced declines in both population and employment between third quarter 1997 and third quarter 1998.
Marion County experienced a slight decline in population with an increase in employment during the same period.