Unaffordability and uncertainty take center stage in 2025 housing market

In the United States, the median first-time homebuyer was 38 years old in 2024, an all-time high, up from 35 in 2023 and 33 in 2019.
Much like the nation, Indiana has seen unprecedented housing price appreciation over the past five years. This, combined with stubbornly elevated interest rates, has put homeownership out of reach for many, particularly millennials and Gen Z. This affordability crisis is reshaping the housing landscape, forcing many to reconsider their paths to homeownership and prompting a closer look at the factors driving these challenges.
Many households are postponing homeownership and either renting or living with family instead. But renting isn’t immune to the affordability crisis, with increasingly expensive rental units leaving households struggling to afford basic living costs.
This overview of the Indiana and national housing market in 2025 presents key indicators such as home sales, home value appreciation, mortgage rates and building permits. It will focus on the persistent affordability crisis facing homebuyers and renters, and how the threat of new tariffs by the U.S. on imported goods (including building materials) may exacerbate it and introduce new uncertainty into the housing market.
Table 1 presents some top-line numbers for the housing market for Indiana and the United States.
Table 1 : Indiana and U.S. housing market by the numbers
| Indicator | Indiana | United States |
|---|---|---|
| Existing home sales 2024 year-over-year change |
0.0% | -0.7% |
| Median sale price appreciation December 2023 to December 2024 |
7.2% | 6.0% |
| Single-family building permits (number of units) 2024 year-over-year change |
17.6% | 6.7% |
| Multi-family building permits (number of units) 2024 year-over-year change |
-35.9% | -17.2% |
| Months supply of inventory December 2024 |
2.2 | 3.3 |
| Rental vacancy rate 2024 third quarter |
10% | 6.9% |
Sources: Indiana Association of Realtors, National Association of Realtors and U.S. Census Bureau
Even though sales and single-family permit issuance are stronger at the state level than nationally (as compared to one year ago), Table 1 highlights some continued challenges. Even though the median sale price is still much lower in Indiana than the U.S. ($252,000 vs. $404,000 in December 2024), Indiana's home prices rose more than the U.S. during 2024. Supply is more constrained statewide than nationally, as well, with Indiana having a month less supply of inventory, which puts some upward pressure on prices.
Housing market at a glance
The federal tariff scenarios being considered at the time of this writing include possible tariffs of 25% on imports from Canada and Mexico and an additional 10% tariff on goods from China. Most economists and homebuilders agree tariffs would raise prices for numerous imported building materials, including softwood lumber, aluminum, gypsum, home appliances and more. These costs added by tariffs levied on imports would also likely exacerbate persistently high mortgage rates. In short, they would be expected to raise the cost of homebuilding; the National Association of Homebuilders estimates that in 2023, 7% of all goods used in new residential construction were imported.1
Though the Federal Reserve has lowered interest rates by 100 basis points since September 2024 (from 5.5% to 4.5%) and is expected to cut rates at least a couple more times in 2025, the 30-year fixed mortgage rate remains high at just under 7% at the time of this writing (early February 2025), per Freddie Mac. This is down from a 2024 peak of 7.22% in May, but significantly higher than the 2024 low of 6.08%, which came soon after the Fed’s 50-basis-point cut in September (see Figure 1).
Figure 1: Weekly average 30-year fixed mortgage rate
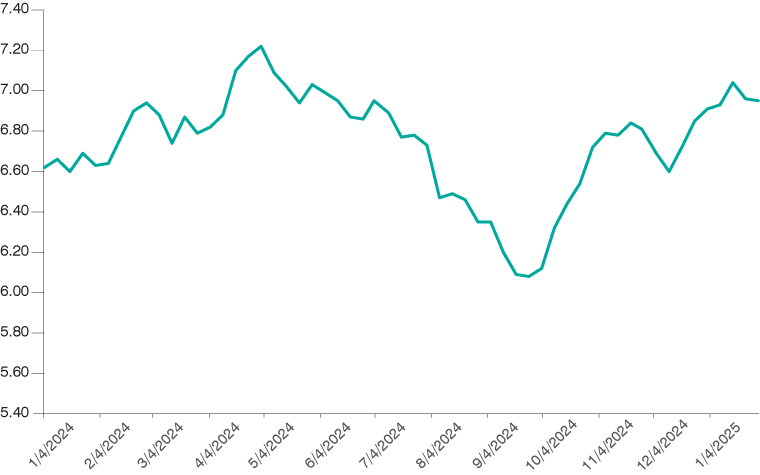
Source: Freddie Mac
Despite the affordability headwinds of high interest rates and high sales prices, nine months in 2024 saw increases in Indiana existing home sales compared to the same month in 2023, while three months saw decreases (see Figure 2). The annual figure was basically unchanged.
Figure 2: Year-over-year percent change in Indiana existing home sales, January to December 2024
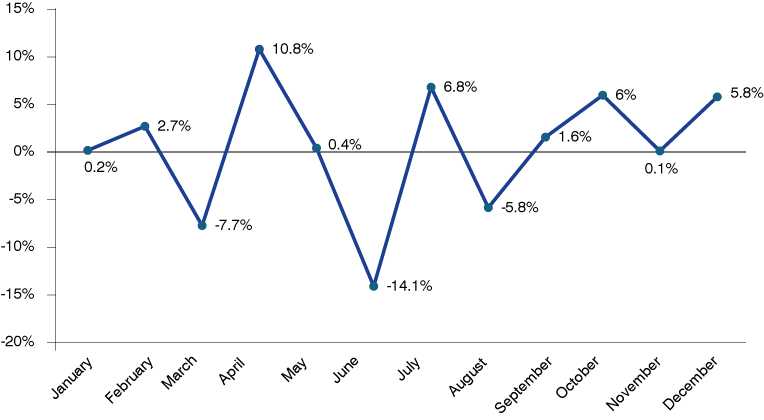
Source: Indiana Association of Realtors
Lack of affordability persists
Homebuying
In the four years between 2020 Q3 and 2024 Q3, home values in Indiana have increased by about 48%, per the Federal Housing Finance Agency’s House Price Index. Over about the same time, Indiana weekly wages have increased by half as much (23%), per the U.S. Bureau of Labor Statistics.2 Table 2 presents the one-, two-, three- and four-year changes in housing values and wages for Indiana and the U.S.
Table 2: Percent changes in housing prices relative to 2024 Q3 and average weekly wages relative to 2024 Q2
Indiana
| Indicator | Housing Price Index, Q3 | Average weekly wages, Q2 |
|---|---|---|
| 2024 value | 358.6 | $1,182 |
| One-year % change | 6.4% | 6.7% |
| Two-year % change | 13.2% | 8.8% |
| Three-year % change | 27.3% | 16.2% |
| Four-year % change | 47.5% | 23.3% |
United States
| Indicator | Housing Price Index, Q3 | Average weekly wages, Q2 |
|---|---|---|
| 2024 value | 426.5 | $1,384 |
| One-year % change | 4.4% | 4.2% |
| Two-year % change | 10.1% | 7.7% |
| Three-year % change | 23.1% | 12.1% |
| Four-year % change | 45.6% | 17.4% |
Note: Both the HPI and average weekly wages are not seasonally adjusted nor are they adjusted for inflation.
Source: Federal Housing Finance Agency and U.S. Bureau of Labor Statistics
Moreover, in 2024, first-time buyers comprised the lowest share of all homebuyers (24%) since the NAR began collecting this data in 1981. This is down from 32% in 2023, 26% in 2022 and 34% in 2021.
Renting
The affordability crunch is not limited to prospective homebuyers, as rents have also been climbing over the past several years. Between 2019 and 2023, median rent increased by 24% in Indiana and 28% in the United States, according to the U.S. Census Bureau American Community Survey. See Figure 3 for a time series of median rents from 2010 to 2023 for Indiana and the United States.
Figure 3 : Median gross rent for Indiana and the United States
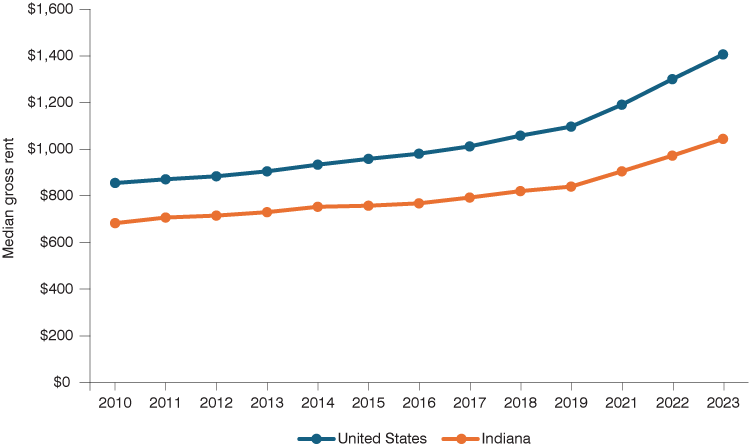
Source: U.S. Census Bureau, American Community Survey, 1-year estimates
Note: Due to pandemic disruptions, ACS 1-year estimates were not produced in 2020.
The National Low Income Housing Coalition’s annual Out of Reach report underscores the disparity between people’s earnings and the cost of affordable rental housing across states, counties and metropolitan areas in the United States. The signature statistic from the report is the “housing wage,” which is an estimate of the hourly wage full-time workers must earn to afford a modest rental home at fair market rent (FMR) without spending more than 30% of their income.
Nationally, the 2024 housing wage is $32.11 for a modest two-bedroom rental (FMR of $1,670) and $26.74 for a modest one-bedroom rental.4 Of the 20 most common occupations in the United States, 14 of them pay less than the one-bedroom housing wage. These occupations account for more than 64 million workers, or 42% of the workforce.5 Clearly, affordable rental housing is out of reach for a vast swath of the workforce.
In Indiana, which has an FMR of $1,148 for a two-bedroom rental, the 2024 two-bedroom housing wage is $22.07. Though this is significantly lower than the U.S. housing wage, Indiana’s lower wages (and $7.25 minimum wage) still contribute to housing being unaffordable for many workers. For a worker earning minimum wage, they must work three full-time jobs to afford a two-bedroom rental at FMR; for a worker earning the state’s average renter wage of $17.92—which is calculated by adjusting the state’s average wage to reflect the income of renter households relative to all Indiana households—they must work 1.2 full-time jobs to afford it.
Conclusion
As the article’s title suggests, the only things we can bank on for the 2025 housing market are continued lack of affordable housing and emerging uncertainty at the federal level. The crackdown on immigration will contribute to larger workforce shortages in the construction industry. The National Immigration Forum estimates that roughly 30% of workers in the U.S. construction industry are immigrants.6 It’s impossible to know how many of those are undocumented and it remains to be seen how the homebuilding industry adapts to workforce disruptions resulting from deportations.
Tariffs on our closest international trading partners in Canada and Mexico would likely lead to higher input costs for residential construction. Both deportations and tariffs combined will likely increase housing costs across the U.S. and Indiana. Regardless of actions the federal government takes around immigration and trade, housing affordability will remain a pressing issue for many communities across Indiana in 2025. As volatility continues, buyers, renters and industry leaders must brace for ongoing challenges in an increasingly unpredictable landscape.
Notes
- Whitman, Victor. “Trump’s trade wars expected to impact homebuilders and homebuyers.” Scotsman Guide. February 3, 2025. https://www.scotsmanguide.com/news/trumps-trade-wars-expected-to-impact-homebuilders-and-homebuyers/.
- Because average weekly wages for 2024 Q3 were not yet available from the BLS Quarterly Census of Employment and Wages at the time of this writing, the four-year period is technically 2020 Q2 to 2024 Q2.
- National Association of Realtors, “Highlights from the 2024 Profile of Home Buyers and Sellers.” https://www.nar.realtor/research-and-statistics/research-reports/highlights-from-the-profile-of-home-buyers-and-sellers.
- National Low Income Housing Coalition, Out of Reach 2024: The high cost of housing. June 2024. https://nlihc.org/sites/default/files/2024_OOR.pdf.
- National Low Income Housing Coalition, “NLIHC releases Out of Reach 2024!” June 28, 2024. https://nlihc.org/resource/nlihc-releases-out-reach-2024.
- National Immigration Forum. “Immigrant construction workers in the United States.” September 12, 2024. https://immigrationforum.org/article/immigrant-construction-workers-in-the-united-states/.