Indiana goods production and exports
Indiana’s exports (as measured by value) have been rising consistently, from $34 billion in 2013 to an all-time high of $55 billion in 2024.
One. Eight. Eight. That’s not an area code or a pin number. Those are Indiana rankings.
Indiana is a leading goods-producing state, ranking first among the states in the concentration of goods production jobs, which account for 21% of all jobs in Indiana (States in Profile). Indiana ranks eighth in the concentration (percent) of jobs in private industry (States in Profile) (see Table 1). And, according to the latest data from WiserTrade at the time of this writing, Indiana is also eighth among states in the value of exports shipped overseas.
Table 1: Top 10 states in concentration of goods-producing jobs and concentration of private industry jobs, December 2024
Goods-producing jobs:
% of total employment
| Rank | State | % of total emp. |
|---|---|---|
| 1 | Indiana | 20.9% |
| 2 | Wisconsin | 20.4% |
| 3 | Iowa | 18.9% |
| 4 | Alabama | 18.3% |
| 5 | Michigan | 17.9% |
| 6 | Idaho | 17.8% |
| 7 | Kentucky | 17.5% |
| 8 | Utah | 17.3% |
| 9 | Wyoming | 17.1% |
| 10 | Arkansas | 17.0% |
Private industry jobs:
% of total employment
| Rank | State | % of total emp. |
|---|---|---|
| 1 | Pennsylvania | 88.6% |
| 2 | Florida | 88.4% |
| 3 | Nevada | 88.1% |
| 4 | Massachusetts | 87.3% |
| 4 | New Hampshire | 87.3% |
| 6 | Rhode Island | 86.8% |
| 7 | Arizona | 86.7% |
| 8 | Indiana | 86.6% |
| 9 | Tennessee | 86.4% |
| 10 | Wisconsin | 86.3% |
Note: Data is not seasonally adjusted.
Source: States in Profile, StatsAmerica; U.S. Bureau of Labor Statistics, Current Employment Statistics (CES)
Recent federal decisions to levy tariffs (some of which are on pause) on selected countries have brought exports into the spotlight. This article provides data on the overall value of Indiana’s exports, but also identifies the most popular goods being exported, as well as the biggest buyers (countries).
Value over time
Indiana’s exports (as measured by value) have been rising consistently, from $34 billion in 2013 to an all-time high of $55 billion in 2024 (through November, final 2024 data will be available after the time of this writing) (see Figure 1 and Figure 2). These figures are nominal (so they don’t take inflation into account), but that $55 billion represents approximately 11% of the state’s current or nominal dollar gross state product (GSP) of $499 billion, according to the latest figures from the U.S. Bureau of Economic Analysis.
Figure 1: The 2020s: Indiana exports in U.S. dollars
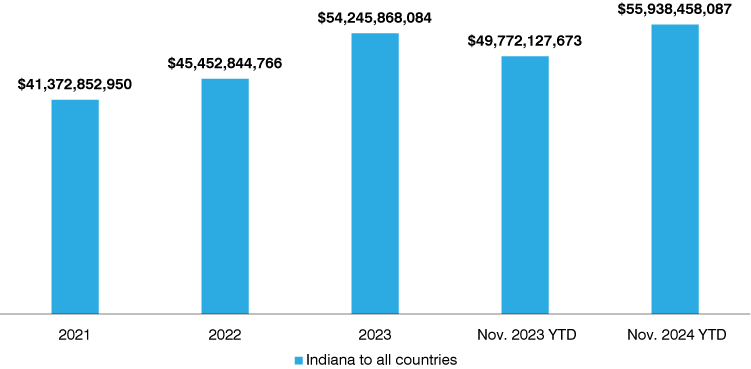
Note: The two columns on the right reflect year-to-date data through November 2023 and November 2024.
Source: IBRC using WiserTrade
Figure 2: Indiana exports over time
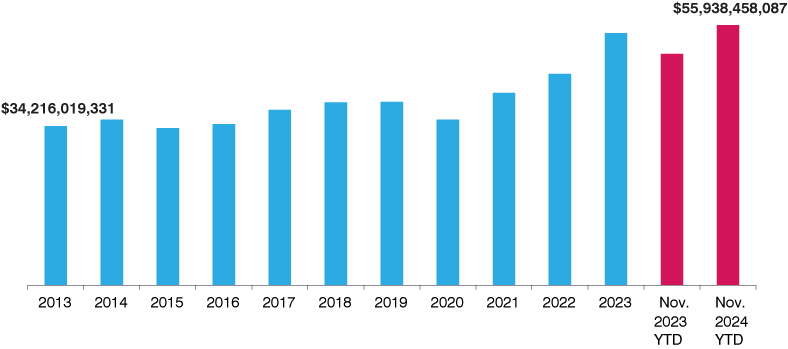
Note: The two columns in red reflect year-to-date data through November 2023 and November 2024.
Source: IBRC using WiserTrade
Top commodities
It isn’t surprising that pharmaceuticals, vehicles, organic chemicals, industrial machinery and surgical instruments are the top five Indiana exports (in dollar volume) (see Table 2). Organic chemicals have recently risen to the top five and are mostly used for products such as agrichemicals, coatings, cosmetics, pharmaceuticals and more, according to the American Chemical Society. The largest importer of Indiana’s organic chemicals may surprise you, as seen in the next section highlighting top countries importing Indiana goods.
Table 2: Indiana’s top 10 exports
| Commodity description | 2024 * | Percent change, 2023-2024 (year-to-date November) |
Percent change, 2013-2023 |
|---|---|---|---|
| Pharmaceutical products | $12,626,487,862 | 29% | 68% |
| Vehicles, except railway or tramway, & parts, etc. | $8,779,115,832 | 8% | 17% |
| Organic chemicals | $7,893,323,473 | 55% | 600% |
| Industrial machinery, including computers | $6,260,329,318 | -11% | 43% |
| Optic, photo, medical or surgical instruments | $3,517,119,824 | 12% | 40% |
| Electric machinery; sound equip; TV equip; parts | $3,492,595,356 | 2% | 74% |
| Aircraft, spacecraft, and parts thereof | $2,160,537,843 | 28% | 71% |
| Plastics and articles thereof | $1,832,339,533 | 4% | 49% |
| Miscellaneous chemical products | $1,342,702,829 | 20% | 65% |
| Iron and steel | $566,523,217 | -6% | -6% |
Note: All 2024 data is year-to-date through November 2024. The 2023-2024 percent change calculation uses year-to-date data through November for both 2023 and 2024.
Source: IBRC using WiserTrade
Leading countries
Canada has long been Indiana’s oldest and largest trading partner, with more than $12 billion in Indiana goods exported there last year (see Table 3). Mexico is also a long-time importer of Indiana goods, purchasing $7 billion of Hoosier exports in 2024. And while China has generally been Indiana’s third-largest trading partner, last year saw Italy importing more than $6 billion in Indiana commodities, with a concentration on purchasing organic chemicals. The remaining charts (Table 3, Figure 3 and Figure 4) provide insight into the change in volume of exports (not adjusted for inflation) over time, as well as more recent increases in exports that vary by each country's industrial and consumer demand for certain goods.
Table 3: Indiana’s billion-dollar export club (countries importing $1B or more in goods from Indiana)
| Rank | Indiana exports to: | 2013 | 2023 | Percent change, 2013-2023 |
2023 * | 2024 * | Percent change, 2023-2024 * |
|---|---|---|---|---|---|---|---|
| 1 | Canada | $11,817,384,222 | $15,050,232,817 | 27% | $13,962,675,355 | $12,970,816,366 | -7% |
| 2 | Mexico | $4,063,073,356 | $7,178,092,954 | 77% | $6,665,069,589 | $6,960,759,748 | 4% |
| 3 | Italy** | $846,054,811 | $3,210,445,648 | 279% | $2,646,610,470 | $6,400,671,519 | 142% |
| 4 | China | $1,345,675,263 | $4,875,796,846 | 262% | $4,457,322,142 | $4,808,009,504 | 8% |
| 5 | Germany | $1,928,133,003 | $3,854,119,614 | 100% | $3,658,447,181 | $3,939,436,477 | 8% |
| 6 | Japan | $1,804,561,606 | $2,391,859,639 | 33% | $2,221,249,049 | $2,910,298,388 | 31% |
| 7 | United Kingdom | $1,037,719,741 | $1,815,024,350 | 75% | $1,642,413,391 | $1,528,130,731 | -7% |
| 8 | Netherlands | $1,174,401,863 | $1,598,558,130 | 36% | $1,459,897,122 | $1,513,257,840 | 4% |
| 9 | Australia | $564,189,256 | $870,936,277 | 54% | $720,759,886 | $1,307,254,659 | 81% |
| 10 | France | $1,387,356,525 | $1,297,089,188 | -7% | $1,181,578,489 | $1,299,522,113 | 10% |
| 11 | Brazil | $1,027,242,592 | $997,986,081 | -3% | $942,482,546 | $1,005,467,789 | 7% |
*2023 and 2024 values used in the short-term percent change calculation are year-to-date data through November 2023 and November 2024.
**Due to a significant increase in imports of organic chemicals, used in agrichemicals, coatings, cosmetics, pharmaceuticals and more, according to the American Chemical Society
Source: IBRC using WiserTrade
Figure 3: Indiana exports: Variations in long- and short-term percent change by country
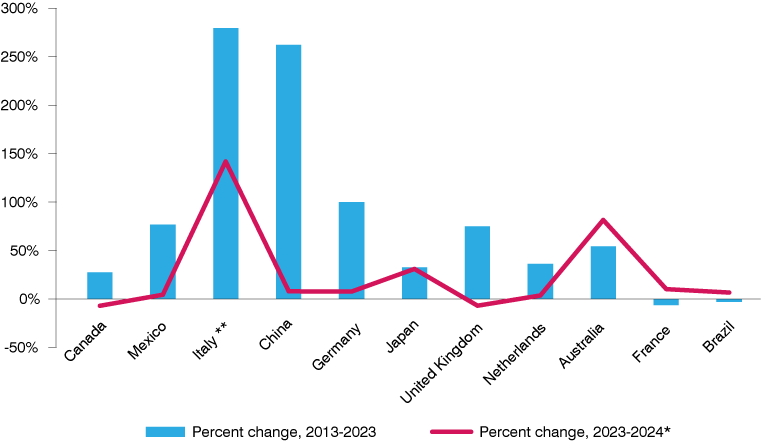
*2023 and 2024 values used in the short-term percent change calculation are year-to-date data through November 2023 and November 2024.
**Due to a significant increase in imports of organic chemicals, used in agrichemicals, coatings, cosmetics, pharmaceuticals and more, according to the American Chemical Society
Source: IBRC using WiserTrade
Figure 4: Percent share of Indiana’s exports to combined three-country total for Canada, Mexico and China
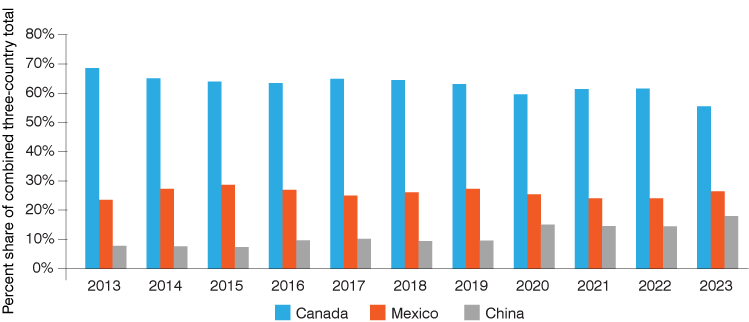
Source: IBRC using WiserTrade
Conclusion
Further information can be found on STATS Indiana via the Exports topic page. Due to the implementation of a new data collection process by Statistics Canada, U.S. state export data has been underreported for October and November 2024. These numbers will be corrected later this year by WiserTrade.