Digging into Indiana's jobs reports over the last five years

Analysts and Fed-watchers have been reading between the lines of the monthly jobs reports to predict whether the economy will achieve a “soft landing:” a “Goldilocks” economy that’s neither too hot (experiencing high inflation) nor too cold (in a recession).
The first Friday of each month, the U.S. Bureau of Labor Statistics (BLS) releases its highly anticipated jobs report for the previous month. The report draws on seasonally adjusted Current Employment Statistics (CES) data to estimate the monthly change in jobs and the unemployment rate. The releases have taken on an outsized significance since the pandemic, with seemingly more people than ever knowing about the jobs report and major media outlets pushing notifications upon its release. While 2020 and 2021 coverage of the report focused more on the recovery from the pandemic shutdowns, now the focus is on how the Federal Reserve may interpret each month’s report when it comes to setting interest rate policy.
More specifically, analysts and Fed-watchers have been reading between the lines of the reports to predict whether the economy will achieve a “soft landing:” a “Goldilocks” economy that’s neither too hot (experiencing high inflation) nor too cold (in a recession). The balancing act for the Fed is raising interest rates just enough to slow the economy and reduce inflation without causing a recession.1 Once the economy starts to cool down a bit—one indicator of which would be slower monthly jobs growth and/or slightly higher unemployment—the Fed should be able to slowly cut its key interest rate.
This article is less concerned about the macroeconomic implications of the monthly jobs reports and more concerned with evaluating how Indiana compares with the nation on jobs growth overall and in key sectors. While the state tracks closely to national trends, the analysis reveals some interesting differences that deserve another look.
A state and national perspective on jobs growth since 2019
In December 2023, the U.S. added 216,000 nonfarm jobs, more than many experts had predicted but still indicative of a cooling job market. The 2.7 million jobs added in 2023 was smaller than in 2021 and 2022, but still represented the fifth-strongest year for job growth since 2000.2
The construction sector was one of the biggest winners in the December report, adding 17,000 jobs, which was above the sector’s 2023 monthly average of 16,000 and the pre-pandemic monthly average of 11,000 in 2019.3 Health care and social assistance (+58,900 jobs) and government (+52,000) also experienced above-trend growth in December 2023.
Indiana gained 800 nonfarm jobs in November 2023—the latest month available at the time of this writing—and 60,600 in the first 11 months of 2023, which was less than gains experienced between January and November of 2021 (+99,700) and the same period in 2022 (+86,700).
The state’s construction sector lost 400 jobs in November, the sector’s first month-over-month decrease since May 2023, when it lost 3,500 jobs. While government employment growth wasn’t as strong as it was nationally, posting a modest gain of 300 jobs in November, health care and social assistance was among those sectors with the most growth at 1,900.
Figure 1 compares nonfarm employment with these sectors of interest in Indiana and the U.S. from January 2019 to December 2023. The employment figures are indexed to make comparison easier.
Figure 1: U.S. and Indiana employment index for total nonfarm jobs and other nationally growing sectors
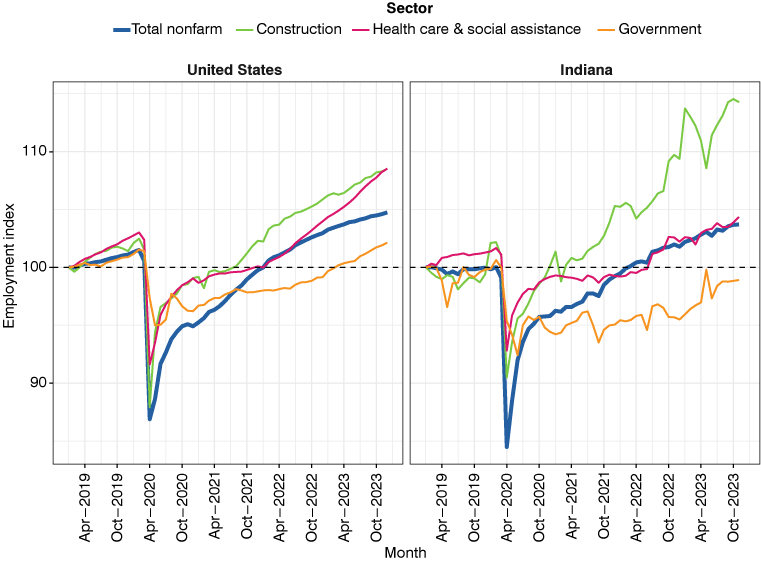
Notes: These data are seasonally adjusted. January 2019 = 100.
Source: BLS Current Employment Statistics (CES) and Indiana Department of Workforce Development
Immediately, one can see the tremendous growth of construction in Indiana, whose employment was 14% greater in November 2023 than in January 2019 and 26% greater than in April 2020. This is despite high interest rates that, in a pre-pandemic economy, would have dissuaded new construction and inhibited employment growth. The construction sector has posted strong gains nationally as well, on par with gains in health care and social assistance. While government employment nationally has surpassed its 2019 level, Indiana is still about 1% short of its January 2019 employment in the sector.
What about other significant sectors in Indiana? Manufacturing and trade, transportation and utilities are two of the highest-employment sectors in the state, while professional and business services and information are two of the highest-paying sectors. Figure 2 shows these sectors in Indiana and the nation to see how the state stacks up.
Figure 2: U.S. and Indiana employment index for total nonfarm jobs and other sectors of interest
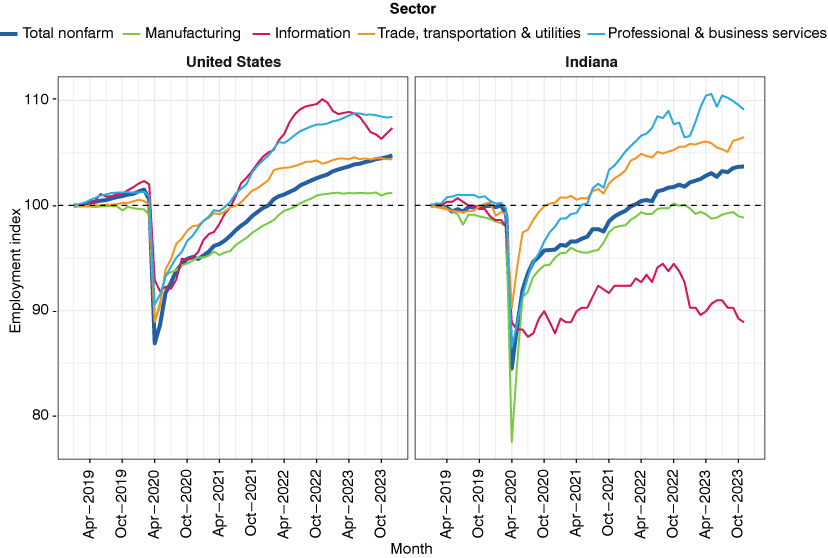
Notes: These data are seasonally adjusted. January 2019 = 100.
Source: BLS Current Employment Statistics (CES) and Indiana Department of Workforce Development
Despite manufacturing’s prominence in the state, its employment is just below its January 2019 number, while professional and business services and trade, transportation and utilities have surpassed it by about 9% and 6%, respectively, as of November 2023.
The loser in Indiana is the information sector, which has hemorrhaged employment since its mid-2019 peak. It showed some signs of recovery during 2021 and 2022 but, as of November 2023, stands about 11% lower than January 2019. Contrast this with the nation, which has experienced booming employment in two high-paying, high-productivity sectors, information and professional and business services. However, it’s worth following the impacts of layoffs in the tech sector, which is evidenced by the decline in information jobs over the first nine months of 2023 in the U.S. panel of Figure 2.
Tables 1 and 2 show the months with the greatest total nonfarm job gains and losses over the past five years. Note that months that are bolded appear in both tables. The U.S. only had four months of job losses over this period, with three of them occurring in the wake of the 2020 pandemic lockdowns and one occurring, interestingly, in February 2019. Indiana’s month with the greatest loss was April 2020—the same as the U.S.—but May and July 2019 and June 2023 also experienced high job losses.
Table 1: Months with the greatest total nonfarm job losses and gains in the U.S. since 2019
| Month | Employment | Change from previous month |
|---|---|---|
| April 2020 | 130,430,000 | -20,514,000 |
| March 2020 | 150,944,000 | -1,427,000 |
| December 2020 | 142,475,000 | -268,000 |
| February 2019 | 150,092,000 | -22,000 |
| June 2020 | 137,620,000 | +4,565,000 |
| May 2020 | 133,055,000 | +2,625,000 |
| August 2020 | 140,799,000 | +1,735,000 |
| July 2020 | 139,064,000 | +1,444,000 |
| September 2020 | 141,760,000 | +961,000 |
Note: Bold indicates the month appears in both tables.
Source: BLS Current Employment Statistics (CES)
Table 2: Months with the greatest total nonfarm job losses and gains in Indiana since 2019
| Month | Employment | Change from previous month |
|---|---|---|
| April 2020 | 2,675,000 | -463,100 |
| March 2020 | 3,138,100 | -28,500 |
| May 2019 | 3,147,800 | -12,000 |
| June 2023 | 3,252,400 | -10,800 |
| July 2019 | 3,147,400 | -7,400 |
| May 2020 | 2,801,600 | +126,600 |
| June 2020 | 2,912,000 | +110,400 |
| July 2020 | 2,962,000 | +50,000 |
| August 2020 | 2,997,100 | +35,100 |
| October 2021 | 3,118,200 | +30,500 |
Note: Bold indicates the month appears in both tables.
Source: BLS Current Employment Statistics (CES) and Indiana Department of Workforce Development
Figure 3 shows the unemployment rates in Indiana and the U.S. over the same period. Indiana tracks closely to the nation, but is consistently lower, especially during the early months of the pandemic recovery. This is likely due to the relatively early expiration of Indiana’s shutdown order relative to other states. By late 2023, however, the unemployment rates converge, as Indiana’s began creeping up after its early-2022 nadir of 2.8%.
Figure 3: Indiana and U.S. unemployment rate
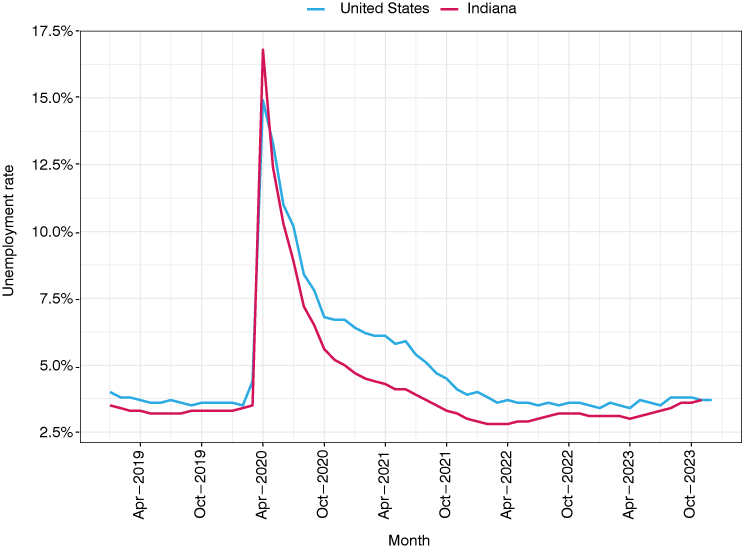
Note: Data are not seasonally adjusted.
Source: BLS Local Area Unemployment Statistics (LAUS)
Conclusion
While the state’s overall employment has recovered from 2020 and surpassed its pre-pandemic levels, the recovery hasn’t been even among different sectors. The anomalous declines in the information sector are worth examining further, especially since this sector has been growing at a national level since April 2020.
TechPoint, an initiative of the Central Indiana Corporate Partnership that focuses on growing the state’s technology sector and promoting innovation, sees the problem as a supply and demand mismatch, writing in its 2023 Indiana Tech Workforce Report:
Despite sustained growth of tech talent in the last decade, tech job hiring figures remain flat, while tech job postings are accelerating. Traditional talent pipelines cannot provide enough talent to outpace Indiana’s declining working-age workforce. Expansion of Indiana’s talent pipeline calls for additional pathways of talent development into the workforce and for more inclusivity.4
It's notable that two high-productivity and high-innovation sectors like information and manufacturing have been slower to recover in Indiana than nationally and slower to recover than other sectors in the state. A lack of supply for jobs in these sectors demonstrates the need for investments in education and training to skill up our workforce and encourage those sitting on the sidelines—not in the labor force—to get in the game. Moreover, the state needs to double down on making (and marketing) Indiana a desirable place to live and work.
Notes
- Boocker, Sam and David Wessel. “What is a soft landing?” The Brookings Institution. September 14, 2023 (updated December 19, 2023). https://www.brookings.edu/articles/what-is-a-soft-landing/.
- Smith, Talmon Joseph. “U.S. added 216,000 jobs in December, outpacing forecasts.” The New York Times. January 5, 2024. https://www.nytimes.com/2024/01/05/business/economy/jobs-report-december-2023.html.
- Irwin, Neil and Courtenay Brown. “Job market surprise: Construction employment is booming.” Axios. January 8, 2024. https://www.axios.com/2024/01/08/jobs-construction-interest-rates.
- Reed, Cheryl. “TechPoint releases 2023 Indiana Tech Workforce Report.” TechPoint. January 31, 2023. https://techpoint.org/techpoint-releases-2023-indiana-tech-workforce-report/.