A slow, uneven recovery for Indiana's child care workforce

The child day care services industry lost a significant share of its workforce because of the pandemic, with its headcount decreasing by 22%. The industry has yet to recover these losses by 2022 Q3.
The Indiana Business Research Center recently conducted a study for Early Learning Indiana (ELI) on the state of the child care workforce across Indiana. ELI is a nonprofit that operates several early learning centers, helps families find quality child care services, partners with teachers and providers to enhance program quality and advocates for greater access to high-quality, affordable early educational opportunities throughout the state.
Amid the recovery from the ongoing COVID-19 pandemic, there’s been broad media coverage, as well as anecdotal and empirical evidence, that child care providers across the country are struggling mightily to recruit and retain workers, threatening the availability, affordability and quality of early learning programs. Indiana is no exception. As part of the study, IBRC conducted a workforce analysis to better understand the child care industry’s challenges on a regional and statewide basis. This article presents some highlights of this analysis.
State trends in the child care industry
The primary data source for the workforce analysis is the Census of Employment and Wages (CEW) from the U.S. Bureau of Labor Statistics (BLS). This data allows us to follow statewide and regional trends in the child care industry on a monthly and quarterly basis through the third quarter of 2022.
Figure 1 shows quarterly statewide employment from 2017 Q1 through 2022 Q3 in the child day care services industry (NAICS 624410), as well as a pre-and post-pandemic average. As you might expect, the industry lost a significant share of its workforce because of the pandemic, with its headcount dropping from 13,712 in 2020 Q1 to 10,680 in 2020 Q2, a decrease of about 22%. For comparison, the total statewide decrease in employment in all industries from 2020 Q1 to Q2 was 9.8%. It’s clear that day cares were hit with a much more severe workforce shock than the state overall, and the industry has yet to recover these losses by 2022 Q3, though it’s getting close.
Figure 1: Indiana child day care services employment, 2017 Q1 to 2022 Q3
Note: The pre-pandemic period is 2017 Q1 to 2020 Q1, while the post-pandemic period is 2020 Q2 to 2022 Q3.
Source: Quarterly Census of Employment and Wages (QCEW), U.S. Bureau of Labor Statistics (BLS)
When compared to some other caregiving industries, as well as one of the fastest-growing industries in the state, general warehousing and storage (e.g., Amazon fulfillment centers), the pandemic-induced shock to day cares becomes even more apparent. Figure 2 compares six of these industries with day cares and total employment in the state. While most experienced losses in 2020 Q2, all but day cares and other individual and family services have bounced back to meet or exceed their pre-pandemic peaks. Indeed, general warehousing and storage, which has been on a steep upward trajectory since early 2017, was undeterred by the pandemic shock of 2020.
Figure 2: Indiana quarterly employment in day cares, total for all industries and comparison industries, 2017 Q1 to 2022 Q3
Source: Quarterly Census of Employment and Wages (QCEW), U.S. Bureau of Labor Statistics (BLS)
Regional trends in the child care industry
While the state overall experienced rapid employment shifts in the wake of the pandemic, its impacts weren’t felt evenly across regions. This section considers the divergent experiences across Indiana’s 12 Economic Growth Regions (EGRs) within the child care industry and the other industries of interest.
Figure 3 shows day care employment in each of the EGRs. Most regions haven’t recovered their pre-pandemic employment by the third quarter of 2022, apart from regions 1, 5, 7 and 9. Reflecting the tremendous growth of the Indianapolis suburbs and exurbs, region 5 employment has far outpaced pre-pandemic levels.
Figure 3: Quarterly employment in day cares by EGR (largest city), 2017 Q1 to 2022 Q3
Note: EGR 5 consists of the “donut” counties surrounding Marion County, while EGR 12 is only Marion County.
Source: Quarterly Census of Employment and Wages (QCEW), U.S. Bureau of Labor Statistics (BLS)
Comparing the other industries of interest with day cares on a regional basis tells a familiar story: Day cares fared worse during the pandemic. However, in some regions, they’ve recovered employment more than the state overall and more than other industries. Figure 4 illustrates this by comparing the pre-pandemic change in employment (the percent change from 2017 Q1 to 2020 Q1, top panel) to the pandemic lockdown (2020 Q1 to 2020 Q2, middle panel) and the recovery (2020 Q2 to 2022 Q3, bottom panel) across regions, as well as to the state. Note that for pre-pandemic, the “beginning” period is an average of 2017 Q1 to 2018 Q2, and the “end” period is an average of 2018 Q3 to 2020 Q1. For recovery, the “beginning” period is an average of 2020 Q2 to 2021 Q1, and the “end” period is an average of 2021 Q2 to 2022 Q3.
Figure 4: Percent change in total, day care and other industry employment by EGR
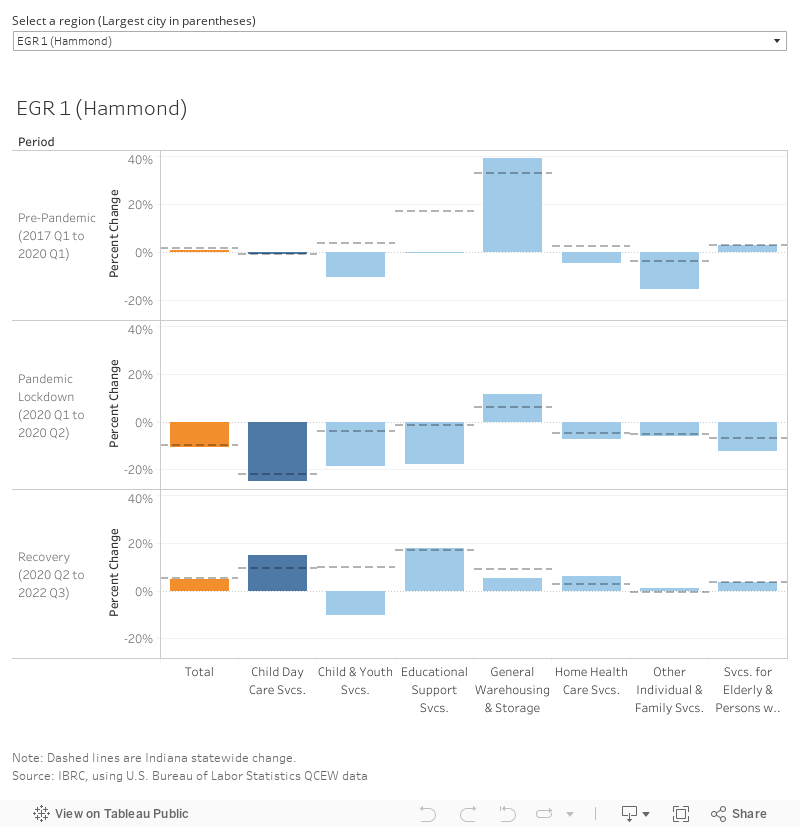
What really sticks out is the scale of the employment loss in day cares over the one-quarter lockdown period. While almost all regions had gains in the two years since the lockdown ended, they were starting from a much lower base in 2020 Q2 than they were pre-pandemic. So, even though region 5’s longer-term recovery was nearly 50% growth—from 2,023 employees in 2020 Q2 to 3,026 in 2022 Q3—its pandemic-induced decline was almost 25%, from 2,666 employees in 2020 Q1 to 2,023 in 2020 Q2.
Another notable finding from the previous two figures is the uneven recovery across regions. Regions 2, 3, 8 and 11 are significantly underperforming the state in day care employment, and don’t appear to be trending up. Whether this is due to closures of child care providers, workers shifting to other industries or other factors is hard to say. At least in regions 2 and 3, the fast recovery of child and youth services suggests some day care workers may be shifting to this industry, but we can’t say for sure.
Conclusion: A vicious cycle contributing to higher child care costs?
The analysis suggests the decline in the child care workforce isn’t really a labor shortage; in most regions across the state, there are many workers with the knowledge and skills necessary to work in day cares. Rather, it’s more about competition: (1) with other industries that offer higher wages, better benefits and more regular hours, and (2) with other responsibilities that force workers out of the labor force.
Most jobs in caregiving are held by women, many of whom have children themselves. Pandemic-driven employment losses were felt more acutely by women, especially those with children; women with children under six accounted for 10% of pre-pandemic employment, but 18% of employment loss during the pandemic, according to the Atlanta Fed.1 Numbers are similar for women with older children.
In the context of day cares, this dynamic lends itself to a vicious cycle: Day care workers are forced out of the workforce to take care of home responsibilities like caring for loved ones, which contributes to child care becoming more difficult and expensive to provide, which leads to more people (more women, in particular) leaving the labor force to take care of their children.
While an analysis of child care costs was outside the scope of the workforce study, it bears mentioning that costs are still much higher than before the pandemic. According to the Care.com 2022 Cost of Care Survey, which surveyed 3,003 U.S. adults that pay for professional child care, 63% reported that child care costs had increased over the past year. More striking is that 51% of parents surveyed spend 20% or more of their income on child care, which is way above the U.S. Health and Human Services 7%-of-income threshold for affordable care.2 Between 2019 and 2021, the cost of care increased for all modes of delivery, from nannies to after-school sitters (see Table 1).
It's certainly possible that the vicious cycle of day care workers leaving the labor force is contributing to higher costs. If so, there’s hope on the horizon, as the state’s day care workforce is inching closer to pre-pandemic levels. It will be interesting to see whether this truly brings costs under control or whether parents will continue to be faced with difficult (and expensive) decisions about how to care for their children and earn an income.
Table 1: National average weekly cost of child care, 2019 to 2021
| Type of care | 2019 | 2021 | % change |
|---|---|---|---|
| Nanny | $565 | $694 | 22.8% |
| Child care center | $215 | $226 | 5.1% |
| Family care center | $201 | $221 | 10.0% |
| After-school sitter | $243 | $261 | 7.4% |
Note: Costs are for one infant.
Source: Care.com 2022 Cost of Care Survey
Notes
- Pitts, M. Melinda. “Where are they now? Workers with young children during COVID-19.” Federal Reserve Bank of Atlanta’s Policy Hub, No. 10-2021. https://doi.org/10.29338/ph2021-10.
- Smith, Linda, Manami Suenaga, and Megan Campbell. “Demystifying child care affordability.” Bipartisan Policy Center. https://bipartisanpolicy.org/blog/demystifying-child-care-affordability/#:~:text=The%20most%20commonly%20cited%20definition,7%25%20of%20a%20household's%20income.